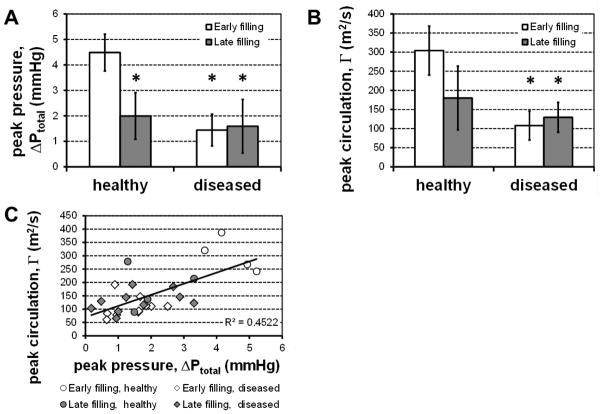
Fig. 3. Comparison of pressure differences and vortex strength.
Whiskers indicate ±1 standard deviation. (A) Peak atrioventricular pressure difference was on average much higher during the relaxation-driven early filling process than either healthy late filling (N=4), or either period in diseased hearts (N=10, *: p<0.05 vs. healthy early filling). (B) A similar trend was observed for the magnitude of the peak circulation measured in the proximal mitral tip ring vortex (*: p<0.05 vs. healthy early filling). (C) These differences appear because not only are the developed pressure difference and the vortex strength strongly coupled (R2=0.45, p<0.001), healthy early filling appears to fall in a separate regime from late and unhealthy filling processes.

