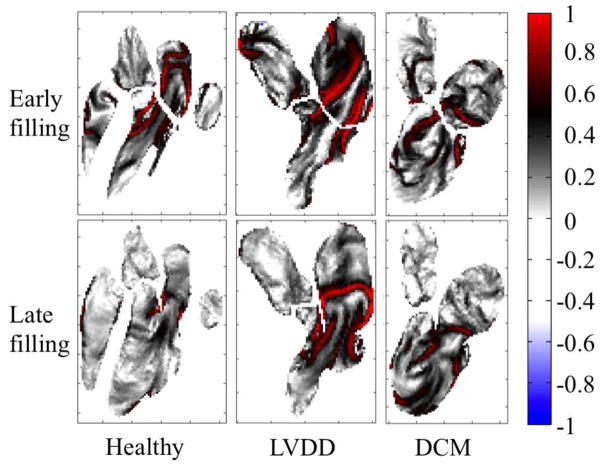
Fig. 4. Maps of finite-time Lyapunov exponents.
The maps are calculated over the early (top) and late (bottom) filling periods for healthy, diastolic dysfunction, and dilated cardiomyopathy patients. Exponents are normalized with the peak value in the LV. Healthy and LVDD patients are the same as shown in Fig. 1 and Fig. 2. Regions marked with red indicate areas of high, exponential rates of separation of adjacent fluid elements, and connected areas of maximum spreading are known as Lagrangian coherent structures. These structures coincide with the inner boundaries of strong inflow vortex rings, and indicate that their presence creates boundaries that entering blood does not easily cross, helping to direct it in a smooth jet toward the apex of the heart. In contrast, the DCM patient shows patterns that reflect the circular, clockwise path of blood through the LV.

