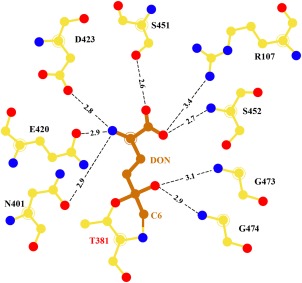
Figure 5.

DON‐bound hGGT. Schematic representation of interactions of DON in the active site of hGGT1. Enzyme carbon atoms are colored yellow, DON carbon atoms are colored orange, oxygens are red, and nitrogens are blue. The distances shown are in Angstroms.
