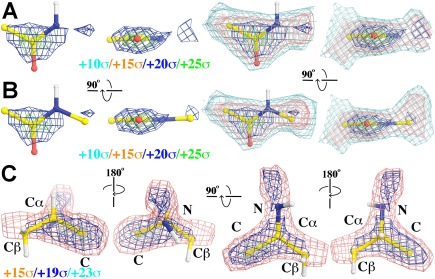
Figure 4.

Averaged experimental ESP density maps. A: Using four non‐H atoms of 20 four‐atom peptide units in averaging, contoured at +10σ (cyan), +15σ (salmon), +20σ (blue), and +25σ (green). B: Using 20 five‐atom peptide units in averaging. C: Averaged experimental ESP map for 20 five‐atom chiral Cα centers in four different views contoured at +15σ (salmon), +19σ (blue), and +23σ (cyan).
