Figure 4.

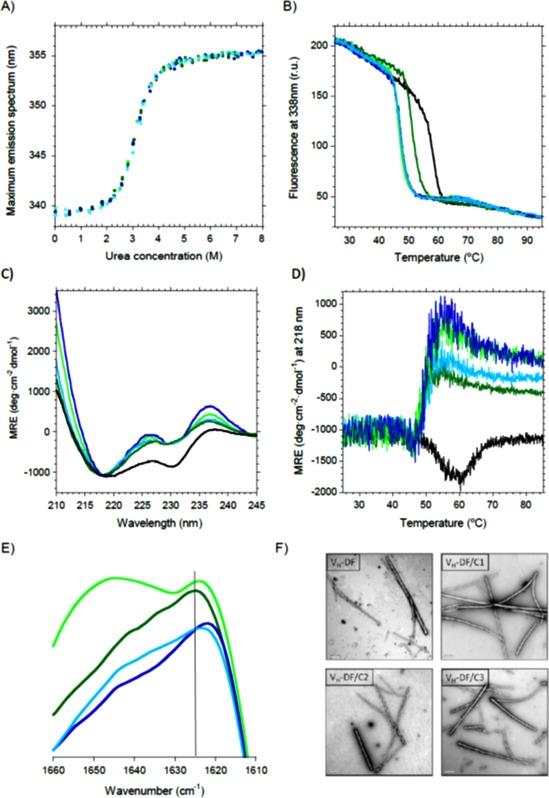
Effect of elongation mutations on V H‐DF. Black, scFv‐h3D6; Dark green, V H‐DF; Light green, V H‐DF/C1; Dark blue, V H‐DF/C2; Light blue, V H‐DF/C3. (A) Urea denaturation curves show no differences with V H‐DF. (B) Thermal denaturation curves followed by Trp‐fluorescence display a decrease in the mid‐point of about 10°C for all the combinations, instead of 6°C for V H‐DF. (C) Circular dichroism shows that both the V H and V L signatures were more evident for the combined mutants. (D) Thermal denaturation followed by CD indicates that V H‐DF unfolds before aggregation occurs, instead of directly reorganizing into a richer β‐sheet conformation that drives to aggregation as in the case of scFv‐h3D6. (E) Amide I' FTIR spectra at 55°C shows that all elongation mutants on V H‐DF display a shift to lower wavenumbers of the maximum of the spectra, indicating that the aggregation tendency in the form of amyloid fibrils has increased. (F) TEM micrographs of V H‐DF and its elongation mutants incubated at 55°C for 5 min show the presence of amyloid fibrils.
