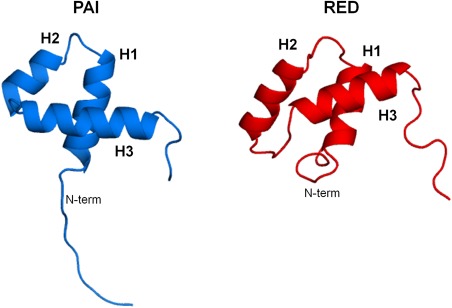
Figure 6.

The comparison of the structures of the PAI and RED subdomains of the SB transposase DNA‐binding domain. The three‐dimensional structures of the PAI (pdb code 2M8E) and RED (right subdomains) are shown using cartoon representation. Protein structures were superimposed and then merely shifted along x (horizontal) axis. The RMSD over backbone Cα atoms between the PAI and RED subdomain structures (excluding flexible termini) is 1.9 Å.
