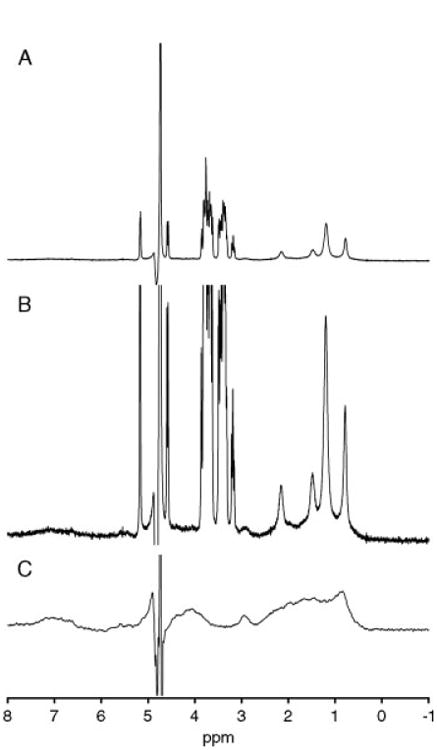
Figure 3.

Reference spectra of ligands and protein used in this study obtained using the difference probe: (A) spectrum of 150 μm HSA, 19 mm octanoic acid, and 125 mm glucose in 10 mm potassium phosphate buffer prepared (pH 7.4) in D2O; (B) spectrum A scaled to show the underlying protein resonances in the baseline and (C) 150 μm HSA loaded into the top coil of the difference probe. For both spectra, potassium phosphate buffer was loaded into the lower sample capillary of the difference probe.
