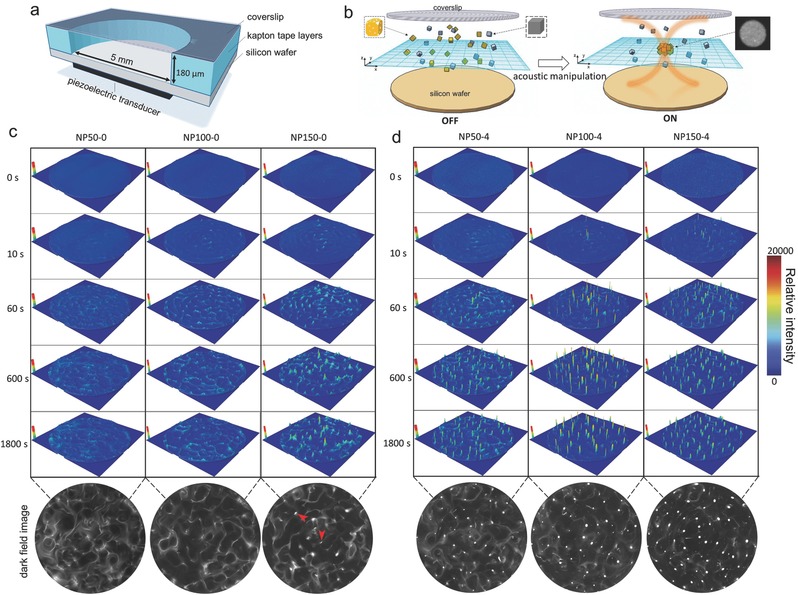
Figure 2.

The acoustic manipulation behavior of metal nanoparticles between solid inner and the hollow nanostructures. a) Schematic illustration of acoustic manipulation system. The piezoelectric transducer was attached to the bottom center of a silicon wafer, with a sample reservoir mounted on top made of Kapton tape layers. A coverslip was used as an acoustic reflector on top. Experiments were carried out in continue sine waves with a resonant frequency of 4.5 MHz and the driving voltage of the acoustic field was 10 Vpp. b) Schematic illustration of the acoustic manipulation effect between solid inner and the hollow nanostructures. The acoustic‐stimulus response behavior of c) the solid inner nanoparticles and d) the hollow nanoparticles. The images versus the levitation plane were recorded by dark‐field optical microscopy and also shown with surface plot by using the 3D surface plot plugin. In all scanned images, the size was 5 × 5 mm.
