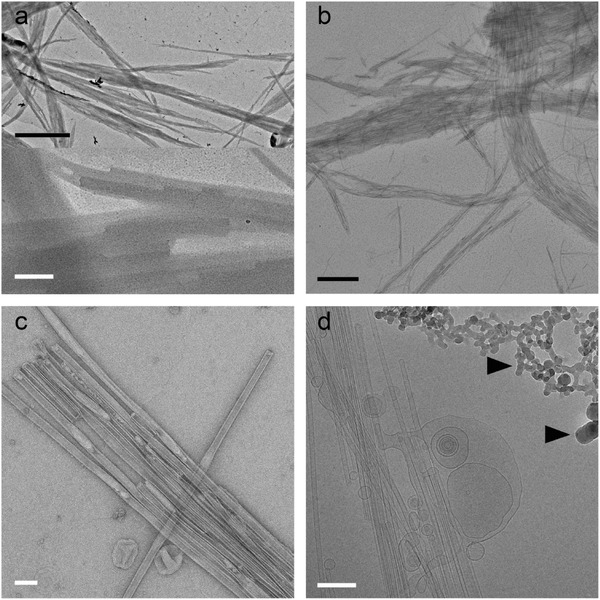
Figure 6.

End capped amphiphilic overcrowded alkene nanotubes. a) dried without staining, b) dried before staining, c) negatively stained with 2% UAc and d) cryo‐electron microscopy. In the dried sample only the contours of the nanotubes are visible but the details are completely lost (lower panel of a). The black arrow heads indicate ice contamination. Black scale bars represent 1 µm, white scale bars 200 nm.
