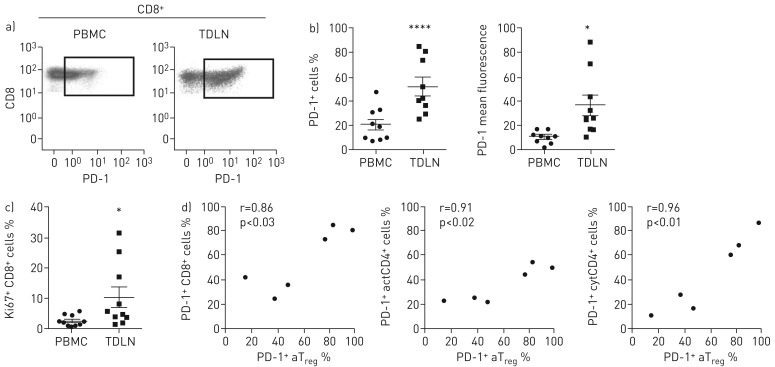
FIGURE 2.
PD-1 expression on CD8+ T-cells. a) Representative examples of PD-1 expression on CD8+ T-cells in peripheral blood mononuclear cells (PBMCs) and tumour-draining lymph nodes (TDLNs). b) Percentages of PD-1 (p<0.0001) and PD-1 mean fluorescence intensity levels on CD8+ T-cells present in PBMCs and TDLNs (p<0.05). c) Percentages of proliferating Ki67+ CD8+ T-cells in PBMCs and TDLNs (p<0.05). d) Pearson correlations between total percentages of PD-1+ cells on activated regulatory T-cells (aTreg) and CD8+ T-cells, activated (act)CD4+ T-cells and cytokine-secreting (cyt)CD4+ T-cells for the six TDLN samples in which we could evaluate aTreg frequencies.

