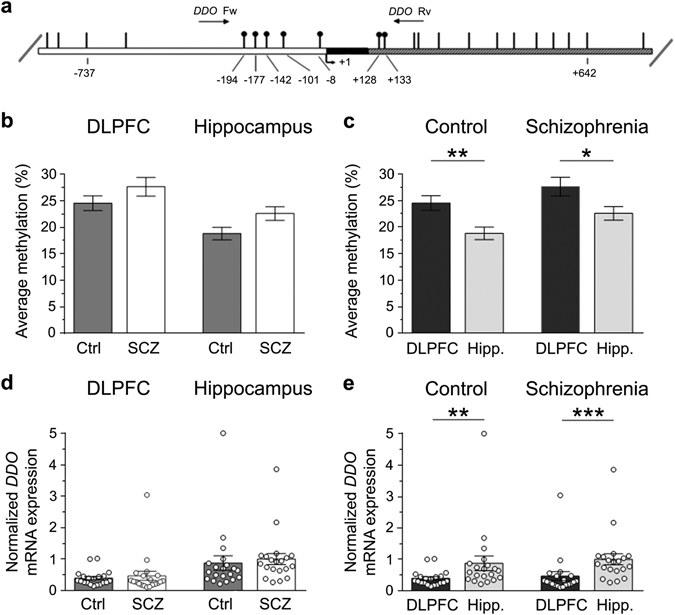
Fig. 3.

DDO gene methylation and DDO mRNA expression in the dorsolateral prefrontal cortex (DLPFC) and hippocampus (Hipp.) of schizophrenia-affected patients (SCZ) and control (Ctrl) subjects. a Structure of the putative promoter of the human DDO gene. Arrow indicates the transcription start site (TSS,+1). White, black, and gray boxes represent, respectively, the putative regulatory upstream region, the exon 1 and the first inton. Position of primers used for bisulfite analysis is indicated by arrows at the top of the map (DdoFw, DdoRv). Vertical bars represent the relative positions of each CpG site. Black circles represent the CpG sites analyzed. b, c Average methylation of the seven CpG sites analyzed is compared b between the two diagnosis groups (DLPFC: Ctrl, n = 20; SCZ, n = 20−hippocampus: Ctrl, n = 20; SCZ, n = 19), or c between the two brain regions (Ctrl: DLPFC, n = 20; hippocampus, n = 20−SCZ: DLPFC, n = 20; hippocampus, n = 19). The percent (%) of methylation represents the average of the seven CpG sites contained in the analyzed region. d, e DDO gene transcription is compared d between the two diagnosis groups (DLPFC: Ctrl, n = 20; SCZ, n = 20−hippocampus: Ctrl, n = 20; SCZ, n = 20), and e between the two brain regions (Ctrl: DLPFC, n = 20; hippocampus, n = 20−SCZ: DLPFC, n = 20; hippocampus, n = 20). The DDO mRNA expression is normalized to the mean of two housekeeping genes and expressed as arbitrary units. *p < 0.05, **p < 0.01,***p < 0.0001 (Mann–Whitney test). Dots represent the single subjects’ values while bars illustrate the means ± SEM
