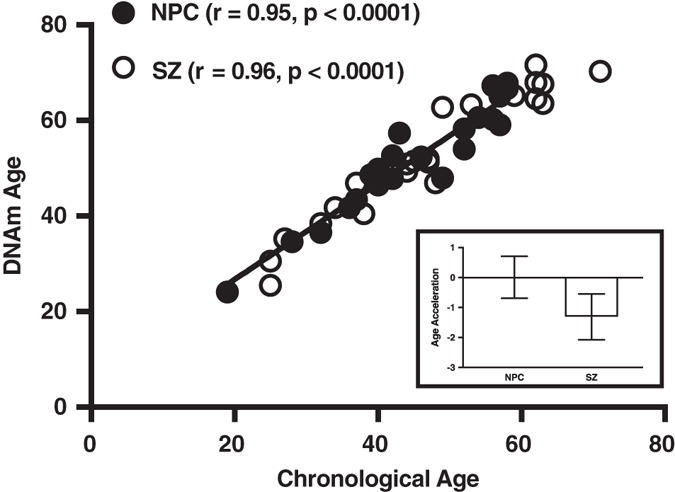
Fig. 1.

DNAm age analysis of the STG. (Main) Scatter plot of DNAm age vs. chronological age. Filled circles correspond to NPC subjects, unfilled circles to SZ subjects. The regression line of DNAm age on chronological age is shown in black. (Inset) Bar graph of age acceleration in and SZ subjects. The bars represent mean ± standard error of the mean. A negative value for age acceleration means the subject’s observed DNAm age is younger than the predicted DNAm age for an NPC subject of the same chronologic age. The average age acceleration in NPC subjects is 0 by definition
