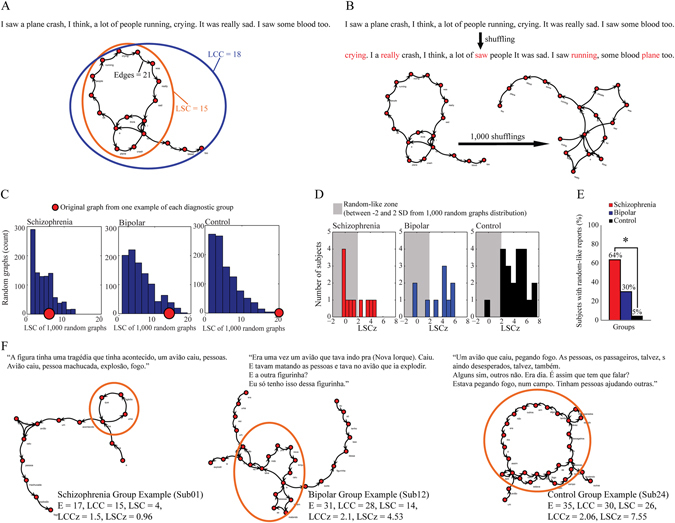
Fig. 2.

Speech graph connectedness attributes and random-like connectedness in schizophrenia. a Illustrative example of a text represented as a graph, showing connectedness attributes Edges, LCC, and LSC. b Illustrative example of random graphs created from an original report. By shuffling word order 1000 times, surrogated graphs maintained the same words but displayed a random word structure (displaced words in red). c Examples of one negative image report compared to 1000 random graphs for each group. Estimation of original LSC (red dot) distance from a 1000 random graph distribution (blue histogram) by z-score—LSCz. d LSCz histogram from each diagnostic group, considering as random-like speech those with LSCz = −2 until 2 (2 standard deviation from a random graph distribution). e Percentage of random-like reports in each diagnostic group (Asterisk means p < 0.05—χ 2 test). f Representative graphs for each group, obtained from negative image reports
