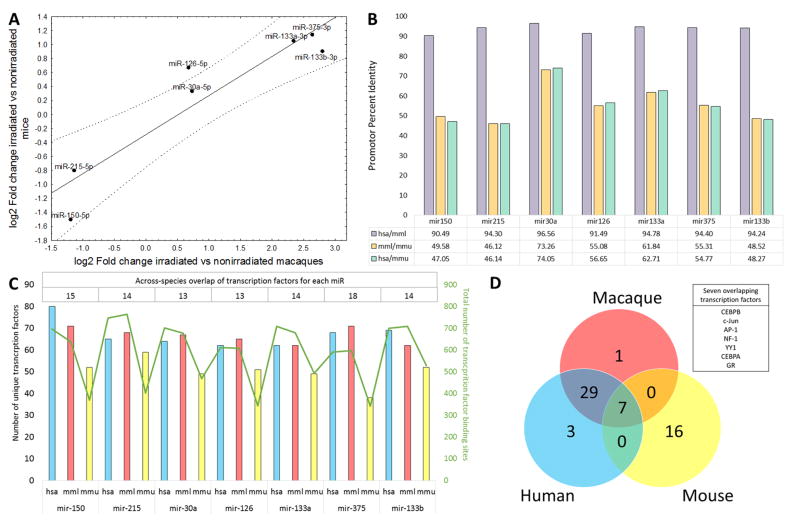
Fig. 2. Conservation of radiation-dependent miRNAs across the species.
(A) Correlation plot of expression differences of miRNAs significantly up- or downregulated in both the NHP and mouse datasets (reanalyzed from Acharya et al. (11)). Data are presented as log2-transformed values on both axes, with a value of 0 corresponding to a lack of change. (B) Percent identity of aligned promoter sequences between Macaca mulatta (mml), Homo sapiens (hsa), and Mus musculus (mmu) for seven selected microRNAs. (C) Number of distinct transcription factors predicted to bind to the promoter region of each microRNA in each species (left Y axis, hsa - blue bars, mml - red bars, mmu - yellow bars), total number of predicted transcription factor binding sites for each microRNA in each species (right Y axis, green line), and number of overlapping transcription factors across the species for each microRNA (top table). (D) Cross-species overlap of the transcription factors with at least one binding site present in all seven microRNA promoter sequences. Seven transcription factors (listed in the text box) had binding sites in all seven microRNAs in all analyzed species.

