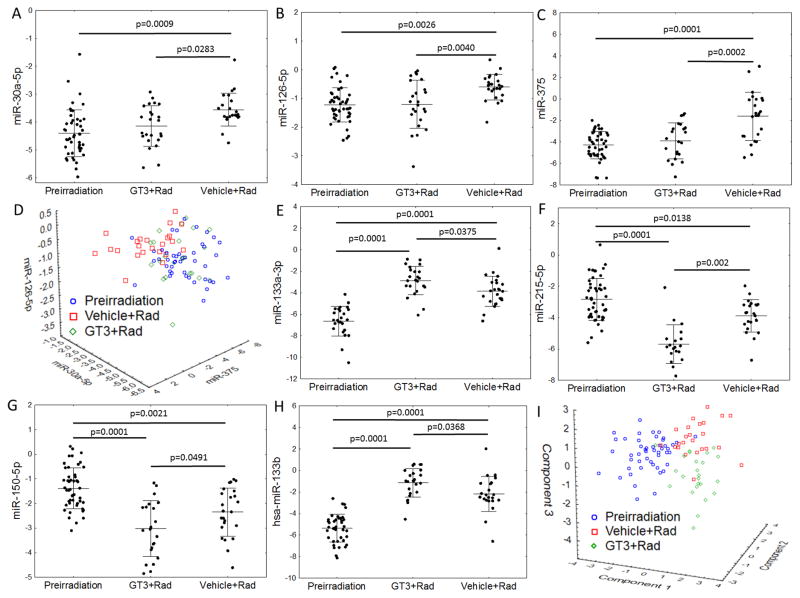
Fig. 3. GT3 (gamma-tocotrienol) rescue’s impact on radiation-dependent miRNA expression.
Expression of the seven miRNAs that showed replicable changes in both NHPs and mice depending on the time point and treatment. Different number of data points in all figures are due to undetectable amounts of particular miRNAs at individual time points. In all cases, significant differences in a post-hoc Tukey’s test are marked with asterisks: (A) miR-30a-5p, (B) miR-126-5p, (C) miR-375. (D) A scatterplot of the expression of three miRNAs (miR-30a-5p, miR-126-5p, and miR-375) grouped by treatment. MiRNA expression in GT3-treated macaques overlapped with that in pre-irradiation samples. Quantities of four miRNAs: (E) miR-133a-3p, (F) miR-215-5p, (G) miR-150-5p, (H) miR-133b showed a more extreme radiation-induced change of expression in GT3-treated macaques in comparison with that observed in vehicle-treated samples. (I) A principal component analysis plot of the three groups. The components were extracted from the seven-miRNA subset. For the purpose of this plot, missing values of the seven miRNAs were substituted with averages.

