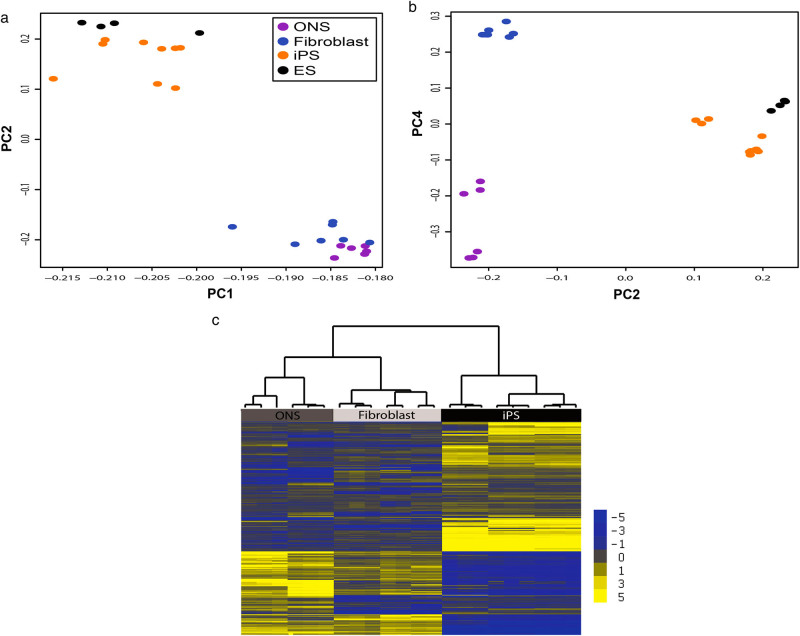
Fig. 1.
Cell types have distinct DNA methylation profiles. a, b Unbiased PCA on all detected probes on array demonstrates that cell types are distinguished by DNA methylated gene loci. a Principal components 1 (x-axis) and 2 (y-axis) separate the pluripotent cells (iPS and ES cells) from the adult tissue-derived cells (ONS and fibroblasts). b Principal components 2 (x-axis) and 4 (y-axis) separate the three cell types from each other. c The individual cell lines separate into cell types after cluster analysis on the probes that were statistically different between the cell types (p < 0.05, FDR correction). Gene loci are illustrated as horizontal yellow and blue lines scaled from the average, which is gray. Higher methylation than average is yellow. Lower than average is blue. Scale is on right. Statistical clustering similarity is shown by the tree diagram. iPS cells are distinctly different from the adult-derived cells (top branch). ONS and fibroblasts are also distinguished from each other (second branch on left)

