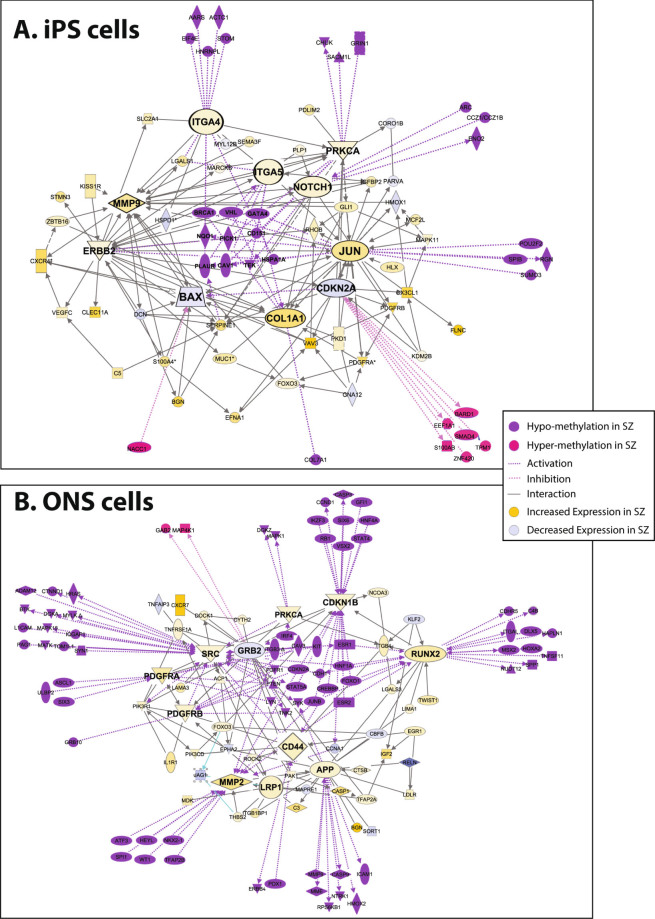
Fig. 3.
Gene interactions among identified genes in cell movement. Interaction networks constructed from the genes that contributed statistically to the GO category cell movement: a iPS cell network; b ONS cell network. Differentially expressed genes in patient-derived and control-derived cells and contributing to cell movement (yellow and blue symbols) were subjected to network analysis based on first-order connections between them (lines). Yellow symbols are genes with increased expression in patient-derived cells; blue symbols are those with decreased expression. The size of the symbols represents the magnitude of difference in gene expression between patient-derived and control-derived cells. Differentially methylated gene loci in patient-derived and control-derived cells were then mapped onto the gene expression network (purple and pink symbols). Purple symbols are hypomethylated loci; pink symbols are hypermethylated loci. The size of the symbols represents the magnitude of difference in DNA methylation between patient-derived and control-derived cells. First-order interactions of identified hypomethylated genes were associated with increased expression of identified genes, whereas hypermethylated genes were associated with decreased expression of identified genes

