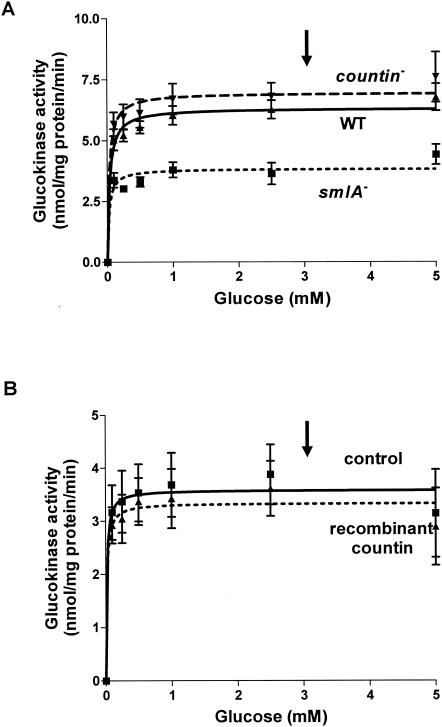
FIG. 3.
Activity of glucokinase in cell lines with different extracellular CF activity. (A) smlA mutant, wild-type (WT), and countin mutant cells were starved by shaking in PBM and collected 6 h later. The activity of glucokinase was measured by varying the concentration of glucose in the assay buffer and by coupling the reaction to the formation of NADPH. Values are means ± standard error of the mean from five independent assays. The Vmax of wild-type cells was 6.3 nmol/mg of protein/min, and the Km was 0.03 mM. (B) Wild-type cells were starved by shaking in PBM and harvested at 6 h of starvation. Cells were treated with 200 ng of bovine serum albumin per ml (control) or recombinant countin for 1 min and then collected. The activity of glucokinase was measured as in panel A. Values are means ± standard error of the mean from five independent assays. The lines show Michaelis-Menten equations fit to the data with nonlinear regression. The arrows indicate the physiological level of glucose (≈3 mM).

