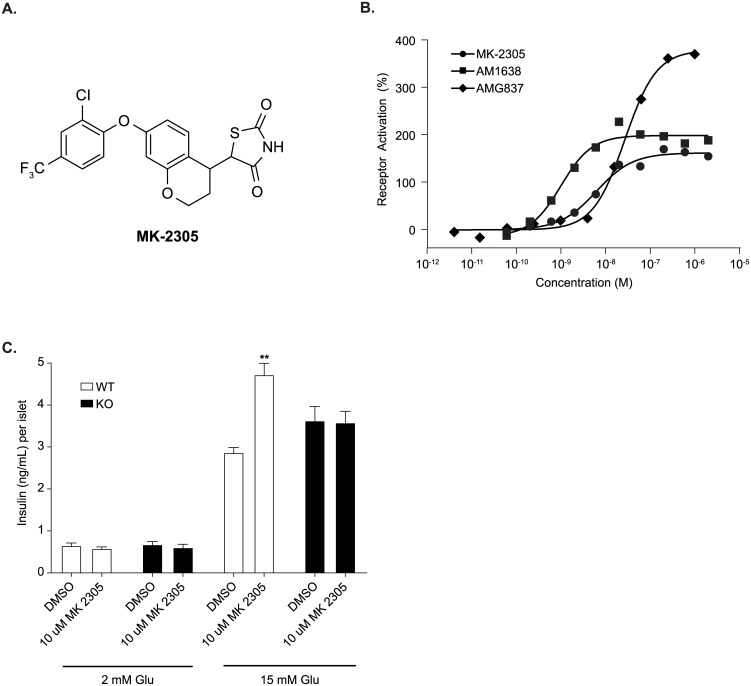
Fig 1. In vitro and ex-vivo pharmacology of MK-2305.
(A) Structure of the synthetic GPR40 partial agonist MK-2305. (B) Dose-response curves for MK-2305 were generated monitoring IP accumulation in CHO cells expressing rat GPR40. Data are expressed as a percentage of the control response of an in-house partial agonist, and fitted to a standard 4-parameter non-linear regression model. EC50’s were determined for each test compound using a custom in-house developed software package. Each experiment was multiple times with a representative graph shown. The mean parameters of these and other individual experiments are shown in Table 1. (C) Effect of MK-2305 on GSIS in isolated GPR40 WT and KO islets under high (15 mM) and not basal (2 mM) glucose. Data provided are means +/- SEM. Data were analyzed via ANOVA followed by Bonferroni multiple comparisons test. **p<0.01compared to DMSO treated islets under 15 mM glucose.

