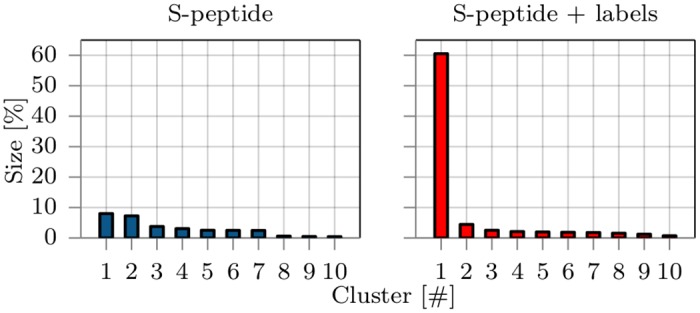
Fig 2. The population size of the ten largest clusters in percentage of lifetime compared to the whole trajectory from simulations without (left panel) and with (right panel) fluorescence labels.

Clustering was based on the RMSD and the single linkage algorithm [35] with a 0.25 nm cutoff was used.
