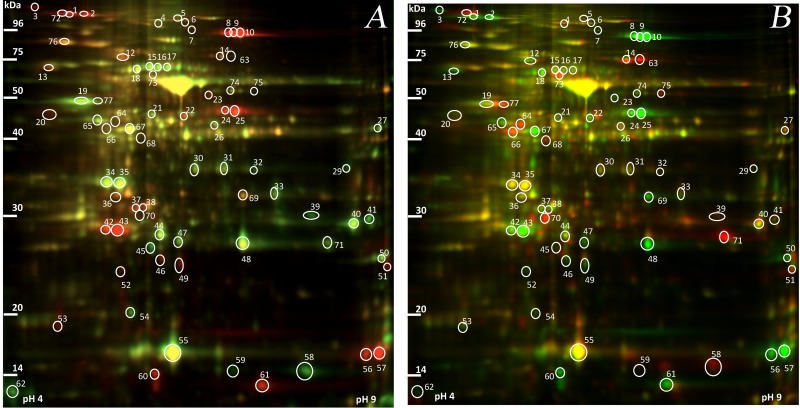
Fig 3. 2D DIGE analyses of leaf proteins.
(A) Protein extracts from acclimated R. catawbiense samples (Cata.CA; labeled with red) and non-acclimated R. catawbiense samples (Cata.NA; labeled with green). (B) Protein extracts from R. catawbiense samples (Cata.CA; labeled with green) and R. ponticum samples (Pont.CA; labeled with red). The positions of 72 differentially abundant protein spots are indicated.

