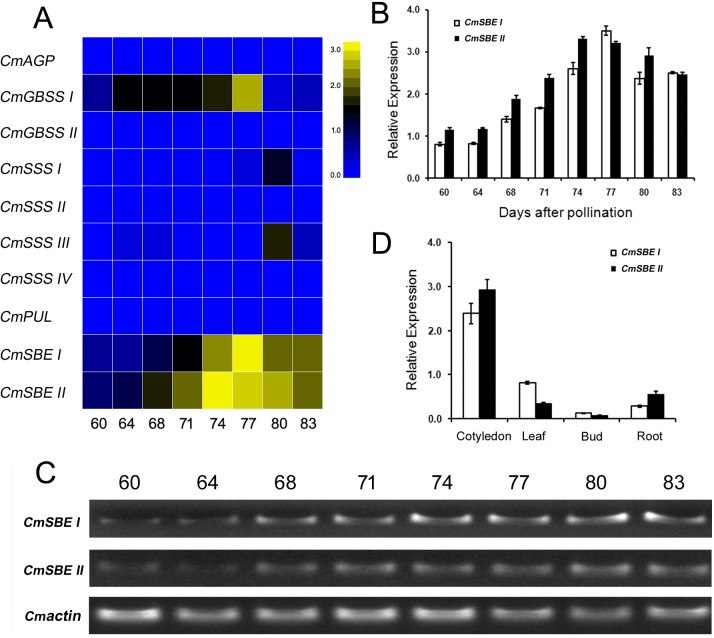
Fig 2. The expression patterns of genes associated with starch synthesis in developing cotyledon, and CmSBE expression pattern in different organs.
A. Heat map showing gene expression of AGP, GBSS, SSS, PUL and SBE during chestnut development. B and C. The relative expressions of CmSBE I and CmSBE II genes in chestnut cotyledon at different days after pollination (DAP) measured by qRT-PCR and semi-quantitative PCR, respectively. The expression of chestnut β-Actin was used as a control. The number of 60, 64, 68, 71, 74, 77, 80, and 83 in A, B and C represents days of cotyledon development after pollination. D. The relative expression levels of CmSBE I and CmSBE II in cotyledon (74 DAP), leaf, bud and root. Values represent the means ± SE (n = 3).

