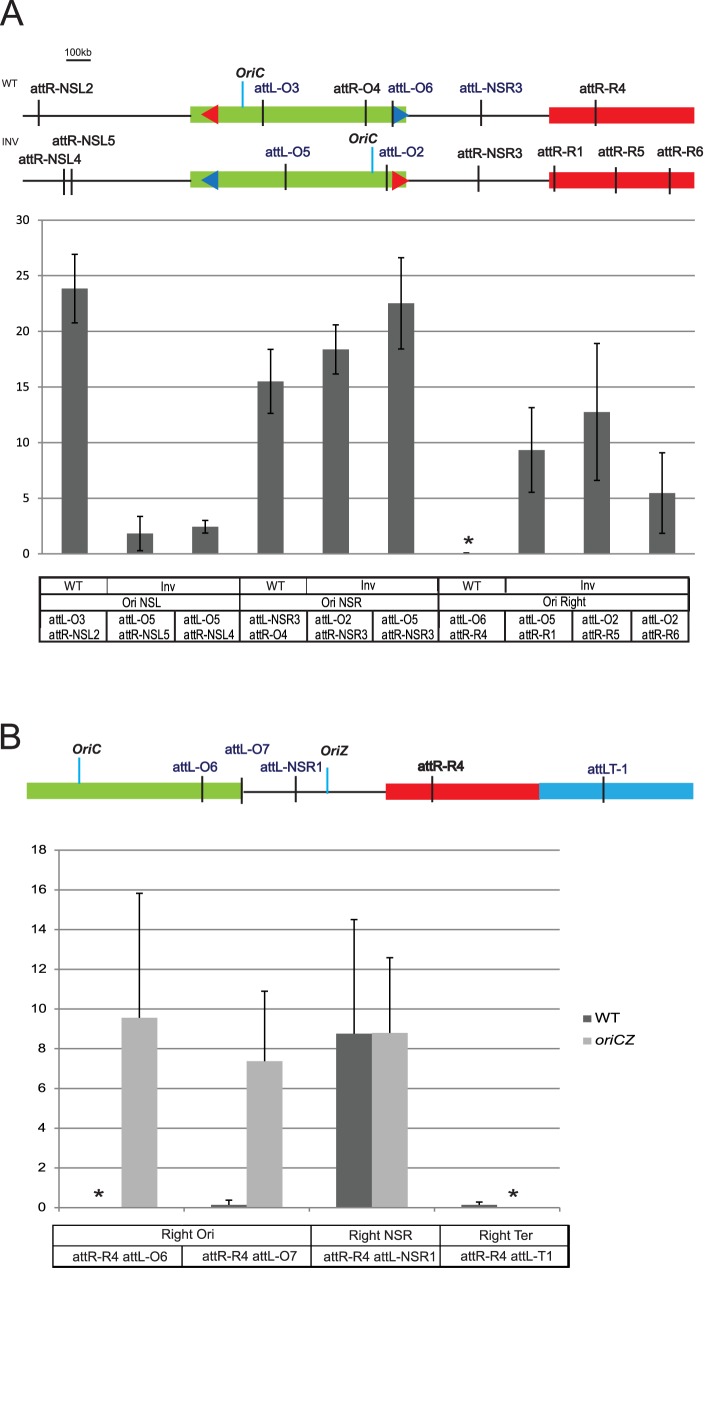
Fig 4. The position of the replication origin changes the Right and Left boundaries.
Histograms of recombination frequencies between attL and attR sequences in WT, and Inv strain. Recombination frequencies between different attR/L sites are indicated on the y-axis. These values are the average of at least 3 independent experiments and the error bars correspond to the standard deviation. For both panels, strains were grown in minimal medium and the recombinase production was obtained by shifting cultures at 38°C for 10’. Relative position of each att sequence used in the experiment is represented on the MD map on top of each panel. The name of the att sequence, and the MD which they belong to, are indicated on the x-axis. The genetic backgrounds are indicated below the histogram (A), or with a color code (B). * indicates that the recombination frequency obtained was repeatedly 0.

