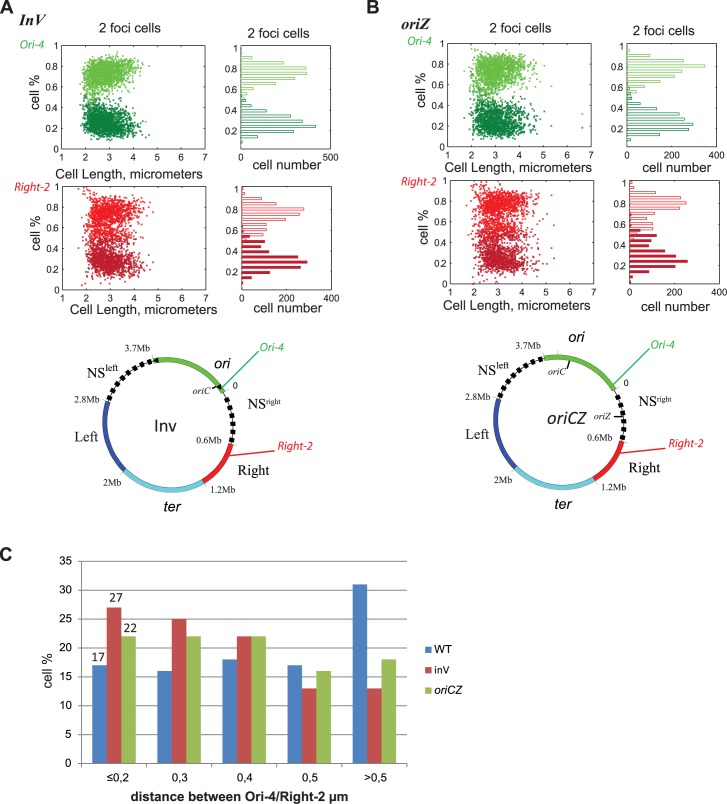
Fig 6. Position of chromosomal loci in the Ori and Right MD depending of oriC position.
MD map of the E. coli chromosome are represented with the position of the Ori-4, Right-2, FROS-Tag in an Inv (A), or oriCZ (B) configurations. For each panel, the position of foci in cell containing 2 foci (cell with one focus are show in S4 Fig), are represent in function of the long axis of the cell (y-axis) and in function of the cell length (x-axis). Red dots and bars correspond to the localization of the Right-2 loci and green ones to the Ori-4 loci. (C) Histogram of the percentage of the population presenting different interfocal distance (<0.2 to > 0.5) between Ori-4 and Right-2 in the WT strain (blue), Inv strain (red) and oriCZ strain (green). Numbers on the first columns show the percentage of cells where both foci are co-localized.

