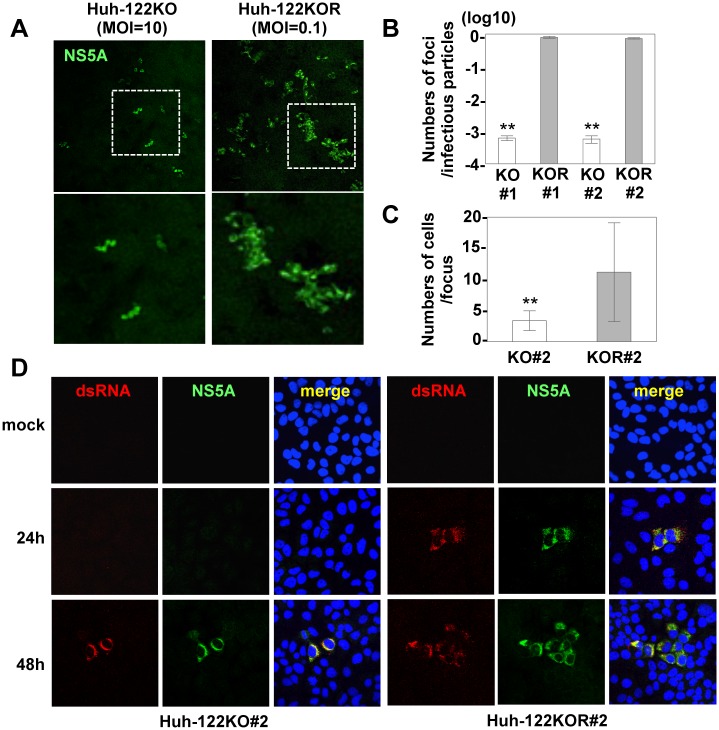
Fig 3. Focus formation in Huh7-122KO cells.
(A) Huh7-122KO (left) and Huh7-122KOR cells (right) infected with HCV at an MOI of 10 or 0.1, respectively, were fixed at 72 hpi and stained with antibodies to NS5A protein (green). The boxes in the top panels were magnified (bottom panel). Numbers of foci per infectious particle (B) and numbers of cells per focus (C, average of 75 foci) in Huh7-122KO (white bar) and Huh7-122KOR cells (gray bar) upon infection with HCV are shown. Error bars indicate the standard deviation of the mean and asterisks indicate significant differences (**P < 0.01) versus the results for the control. (D) Focus formation in Huh7-122KO (left) and Huh7-122KOR cells (right) infected with HCV at an MOI of 0.1 or 10, respectively. Each cell was fixed at the indicated time post-infection and stained with appropriate antibodies to dsRNA (red) and NS5A (green). Cell nuclei were stained with DAPI (blue).

