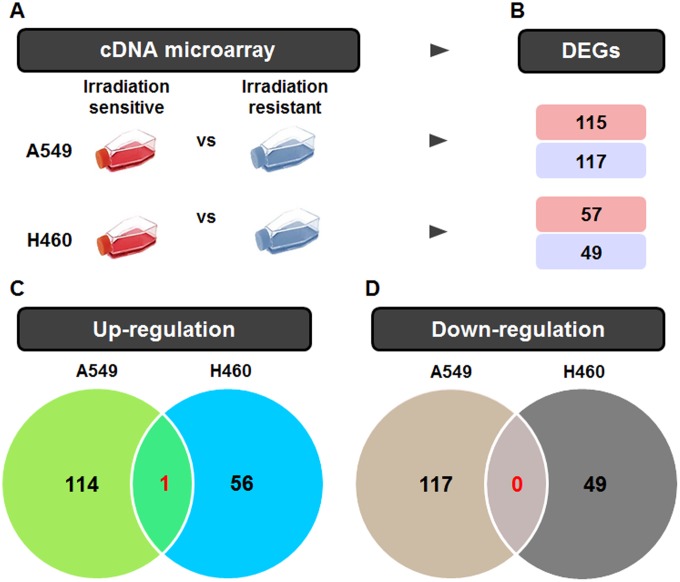
Fig 1. Venn diagram summarizing the differentially expressed genes (DEGs) in radiation-treated A549 and H460 cells.
(A) The radiation-related gene expression signatures of A549 and H460 cells were collected using cDNA microarrays. (B) The differential gene expression in each group was shown for the unique upregulated and unique downregulated DEGs. (C) The number of up-regulated genes in each group and the number shared by the different groups are depicted in a Venn diagram. (D) The number of down-regulated genes in each group is also expressed in a Venn diagram.

