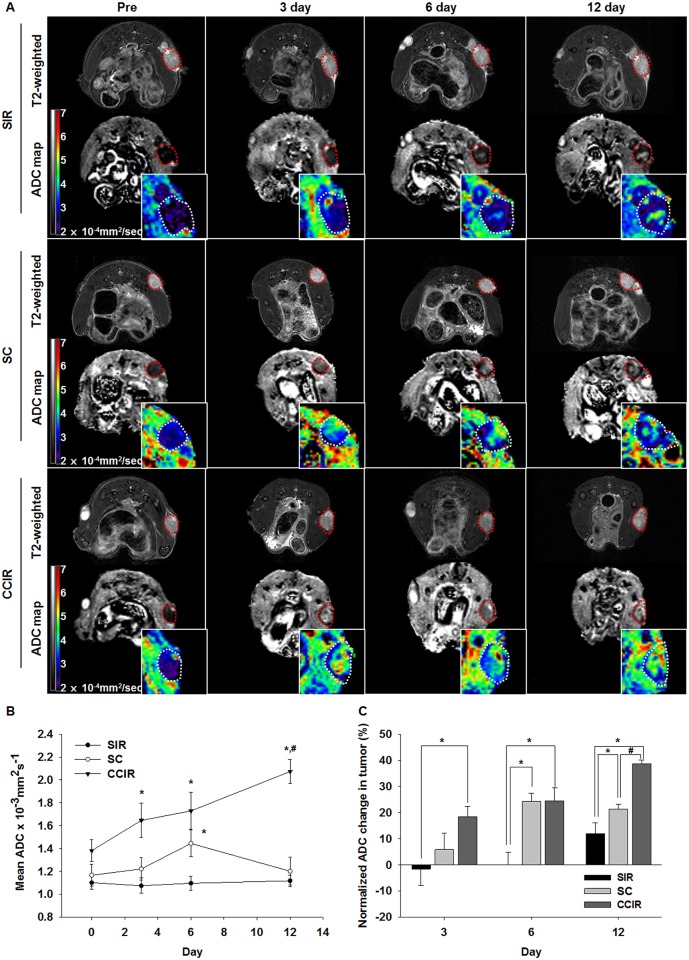
Fig 4. Diffusion-weighted image analysis of the tumor response to treatment.
(A) T2-weighted images and apparent diffusion coefficient (ADC) maps obtained before, during, and at different times after therapy in mice treated with ionizing radiation (IR, 10 Gy), celastrol (2 mg/kg/5 days), or IR combined with celastrol therapy. The tumors were indicated with the dotted contours. The intratumoral ADC value (B) and ADC change (C) measured at 3, 6, and 12 days after the mice had been treated with IR (10 Gy), celastrol (2 mg/kg/5 day), or the combination therapy. The data represent the mean ± SEM. Statistically significant differences between the groups are indicated by the following symbols: *p ≤ 0.05 vs SIR; #p ≤ 0.05 vs SC. SIR, single ionizing radiation; SC, single celastrol; CCIR, celastrol-combined ionizing radiation.

