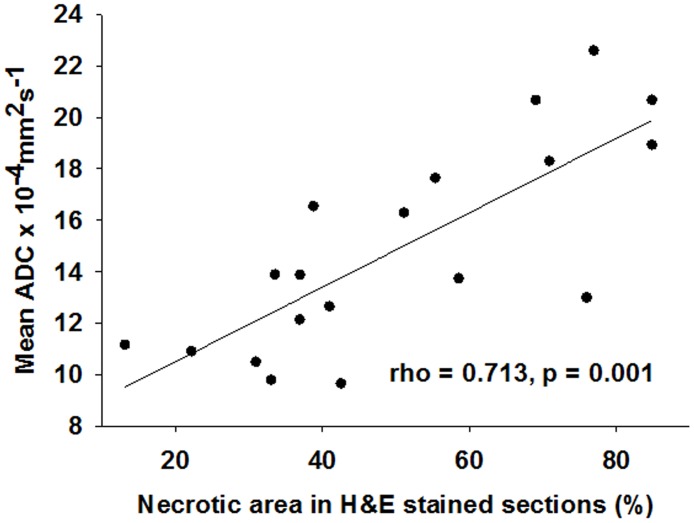
Fig 6. Correlation between the mean ADC change and percentage tumor necrotic fraction.
The mean ADC values correlated with the percentage tumor necrotic fraction calculated from the H&E-stained sections from the A549 tumors. Spearman’s rank-order correlation test was applied to calculate the Spearman correlation coefficient (rho = 0. 713, p = 0.001). The solid lines are the result of the linear regression on the data.

