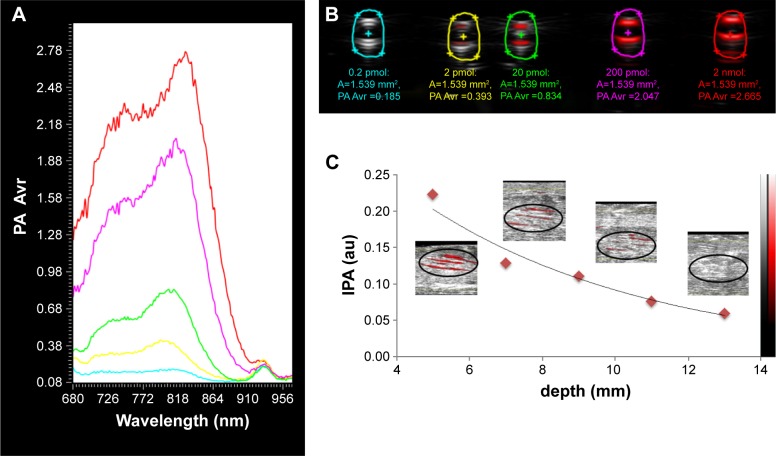
Figure 3.
(A) PA spectra of ICG liposomes at various concentrations, colors corresponding to ROIs from (B). (B) Overlay of US (grey) and PA (red) images from ICG liposomes at various concentrations. (C) Depth dependence of IPA signal from ICG liposomes in chicken breast phantom.
Abbreviations: PA, photoacoustic; ICG, indocyanine green; ROI, region of interest; US, ultrasound; Avr, average; IPA, PA average intensity.

