
Figure 3.
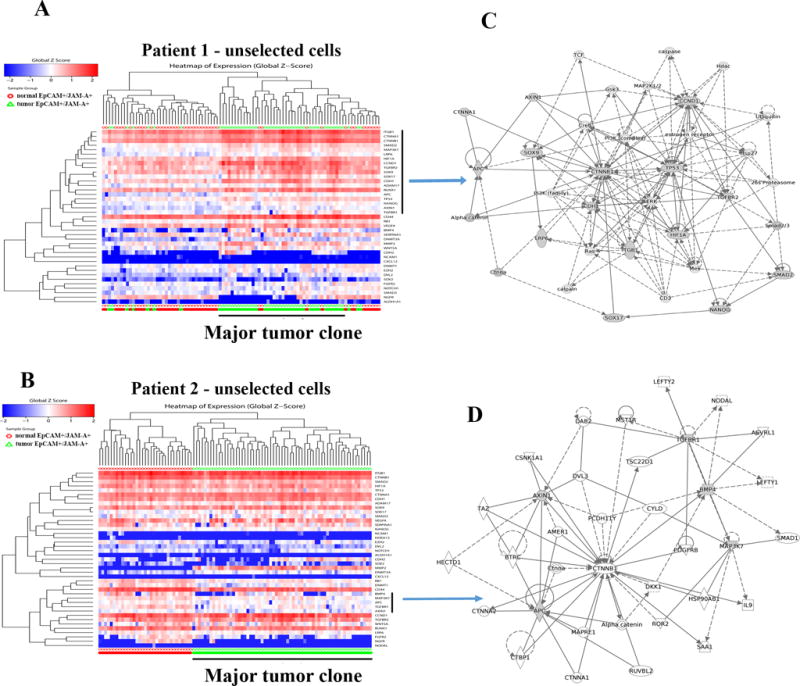
Genes linked to stemness differentiate tumor cells from normal cells. A) Heatmap depicting expression pattern of stemness-associated genes in unselected cells of tumor and adjacent normal of patient 1. A vertical bar on right side denotes genes overexpressed in tumor cells compared to normal cells. Red and green bars at the bottom indicate normal and tumor cells, respectively. B) Heatmap depicting expression pattern of stemness-associated genes in unselected cells of tumor and adjacent normal of patient 2. A vertical bar on the right side denotes genes that are expressed at a lower level in tumor cells compared to normal. C) Stemness cell signaling network uniquely active in tumor cells of patient 1. Network was generated using genes indicated by a vertical bar in A. Genes with shaded boxes in the network are differentially expressed in tumor cells compared to normal cells. D) Signaling network in tumor cells in patient 2. Negative regulators of Wnt signaling pathway such as AXIN1 and APC were expressed at lower levels in tumor cells compared to normal cells.