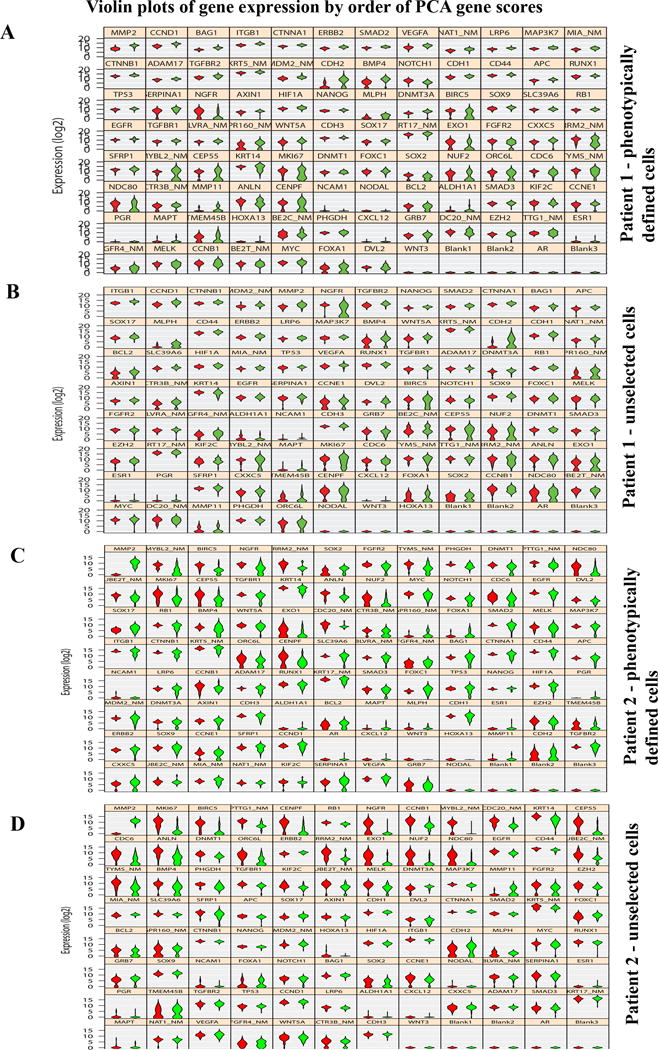
Figure 7.

Identifying genes truly differentially expressed in tumors compared to normal. Violin plots show genes truly overexpressed or underexpressed in all tumor cells compared to all normal cells. Width of the violin depicts expression frequency at that level. A) Data from phenotypically defined cells of patient 1. B) Data from unselected cells of patient 1. C) Data from phenotypically defined cells of patient 2. D) Data from unselected cells of patient 2.
