
Figure 3. Mutant KRAS upregulates SGs by modulating the cellular capacity to biosynthesize and catabolize prostaglandins.
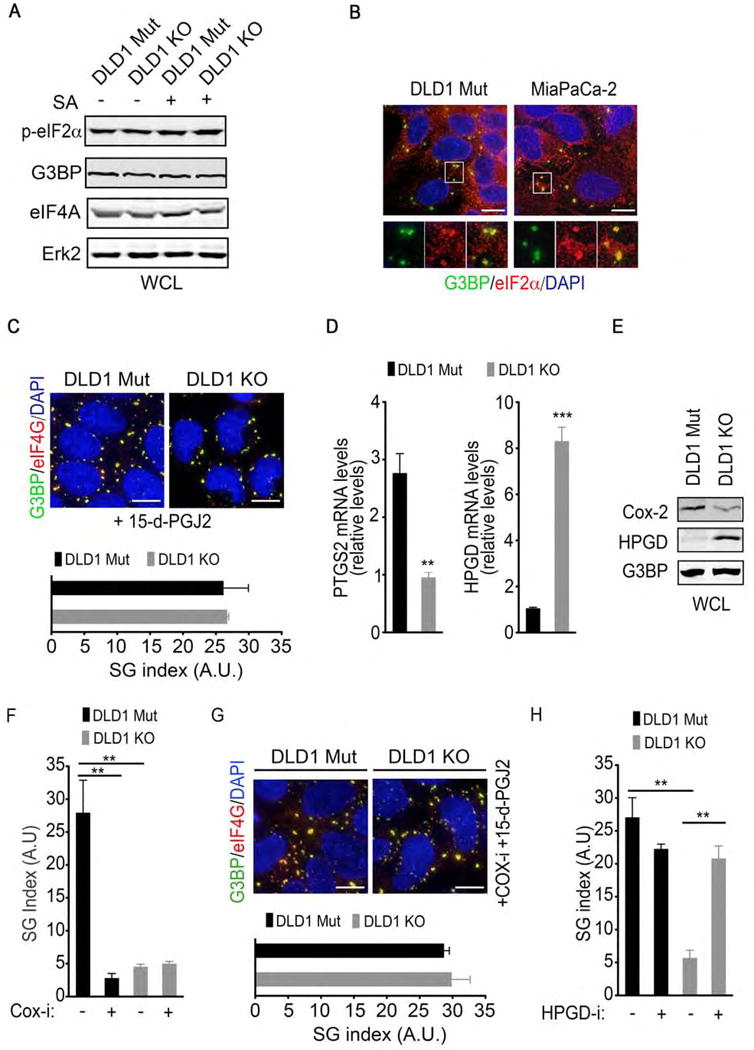
(A) DLD1 Mut and DLD1 KO cells were treated with SA (100 μM, 1hr). Whole cell lysates (WCL) were collected and subjected to immunoblotting with the indicated antibodies. ERK2 serves as a loading control.
(B) DLD1 Mut and MiaPaCa-2 cells were treated with SA as in A and SGs were detected by immunofluorescence staining for G3BP and eIF2α.
(C) DLD1 Mut and DLD1 KO cells were treated with 15-d-PGJ2 (50 μM, 1hr). SGs were detected by immunofluorescence staining for G3BP and eIF4G (top). SG index based on G3BP immunofluorescence (bottom) is shown.
(D) PTGS2 and HPGD mRNA levels in DLD1 Mut and DLD1 KO cells were assessed by quantitative RT-PCR. Error bars indicate SEM (n=3).
(E) COX-2 and HPGD protein levels in DLD1 Mut and DLD1 KO cells were assessed by immunoblotting of whole cell lysates (WCL) with the indicated antibodies. G3BP serves as a loading control.
(F) DLD1 Mut cells were treated with diclofenac sodium (20 μM, COX-i) for 12 hrs followed by SA treatment (100 μM, 1hr). SG index based on G3BP immunofluorescence is shown.
(G) DLD1 Mut and DLD1 KO cells were treated with diclofenac sodium (COX-i) as in Figure 3F and 15-d-PGJ2 as in Figure 3C. SGs were detected by immunofluorescence staining for G3BP and eIF4G (top). SG index based on G3BP immunofluorescence is shown (bottom).
(H) DLD1 Mut and DLD1 KO cells were treated with a HPGD inhibitor (HPGD-i; 40 μM) for 6 hrs followed by SA (100 μM, 1hr). SG index based on G3BP immunofluorescence is shown.
(A–C, E–H) Data are from a representative experiment out of at least 3 independent experiments.
(C, F–H) Error bars indicate mean −/+ SEM for at least 4 fields of view with at least 50 cells/field of view.
**p<0.005, ***p<0.0005. Scale bar, 10 μm.