
Figure 4. Cell non-autonomous upregulation of SGs by mutant KRAS is mediated by 15-d-PGJ2.
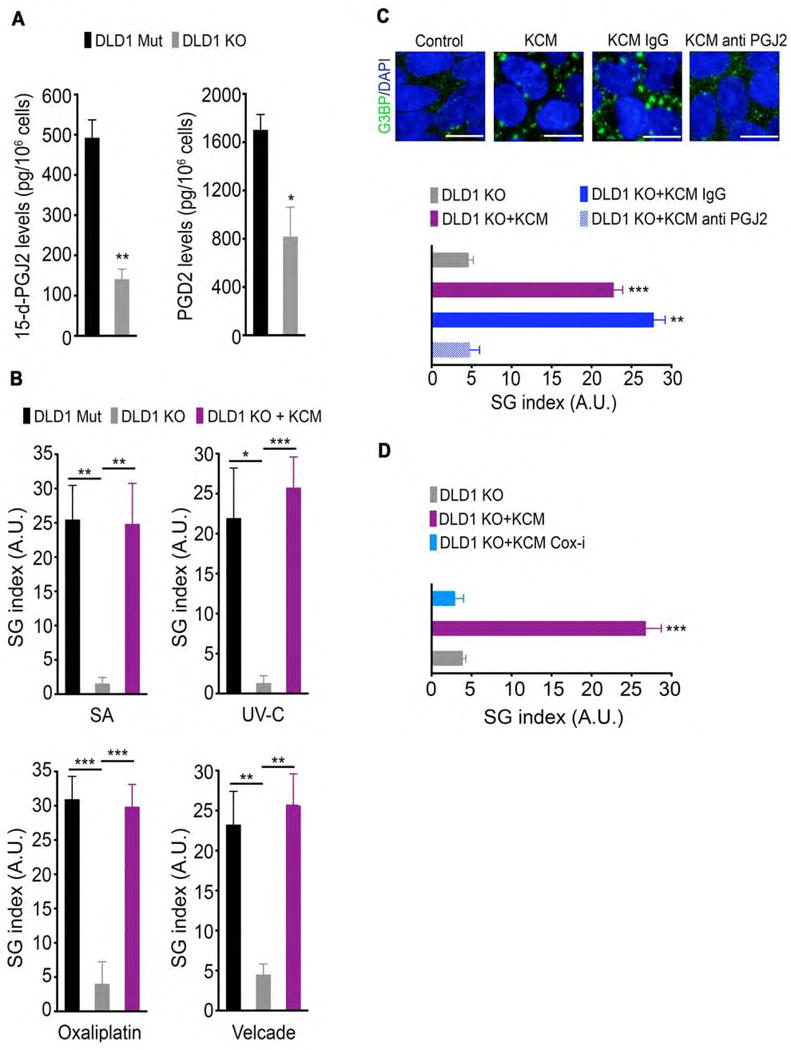
(A) The levels of 15-d-PGJ2 and PGD2 that were secreted by DLD1 Mut and DLD1 KO cells were determined by ELISA of the respective cell culture medium. Data are represented as mean −/+ SEM.
(B) DLD1 Mut and DLD1 KO cells were incubated for 10 min in control medium or in conditioned medium from DLD1 Mut cells (KRAS conditioned media; KCM) and then treated with SA, UV-C irradiation, oxaliplatin, or velcade as in Figure 1G. SG index based on G3BP immunofluorescence is shown.
(C) DLD1 KO cells were incubated as in Figure 4B in control medium, KCM, KCM immunodepleted with anti-IgG (KCM IgG), or KCM immunodepleted with anti-15-d-PGJ2 (KCM anti PGJ2) and then treated with SA (100 μM, 1hr). SGs were detected by G3BP immunofluorescence staining (top). SG index based on G3BP immunofluorescence is shown (bottom).
(D) DLD1 KO cells were incubated as in Figure 4B in control medium, KCM, or KCM from cells treated with diclofenac sodium (COX-i), and then treated with SA (100 μM, 1hr). SG index based on G3BP immunofluorescence is shown.
Data are from a representative experiment out of least 3 independent experiments. Error bars indicate mean −/+ SEM for at least 4 fields of view. *p<0.05, **p<0.005, ***p<0.0005. Scale bar, 10 μm.