
Figure 5. KRAS cancer cells exert cell non-autonomous protection from chemotherapeutic agents via SG upregulation.
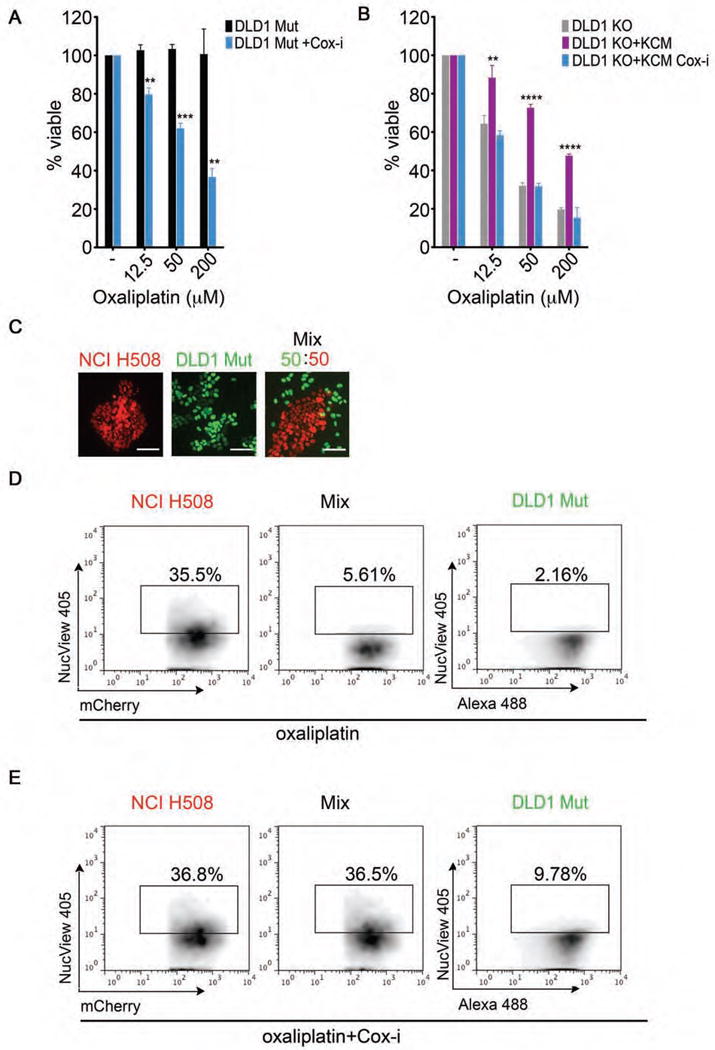
(A) Medium obtained from DLD1 Mut cells treated −/+ diclofenac sodium (COX-i) was utilized to dilute oxaliplatin at the indicated concentrations and added back to the respective conditions for 48 hrs. Cell viability was assessed using the MTT assay.
(B) Medium from DLD1 KO cells (control medium), KCM, and KCM from diclofenac sodium (COX-i) treated cells was used to dilute oxaliplatin to the indicated concentrations and added to DLD1 KO cells. Cell viability was assessed using the MTT assay after 48 hrs.
(C) Fluorescence images of mCherry-H2B-labeled NCI H508 cells (red), GFP-H2B-labeled DLD1 Mut cells (green), cultured individually or as a mixture. Scale bars represent 40 μm.
(D) The indicated cells lines were labeled and cultured as in (C) and subjected to oxaliplatin (100 μM, 48 hrs). Cell death in each population was assessed by flow cytometry analysis of NucView Alexa 405 positive cells.
(E) The indicated cells lines were cultured as in (C) and subjected to diclofenac sodium (20 μM, COX-i) as in Figure 4D followed by oxaliplatin (100 μM) for 48 hrs. Cell death in each population was assessed as in Figure 5D.
(A–B) Data is expressed as percentage of viable cells. Error bars are mean +/− SEM from 3 independent conditions each performed in triplicate. **p<0.05, ***p<0.005, ****p<0.0005.
(D–E) Data are from a representative experiment out of at least 3 independent experiments.