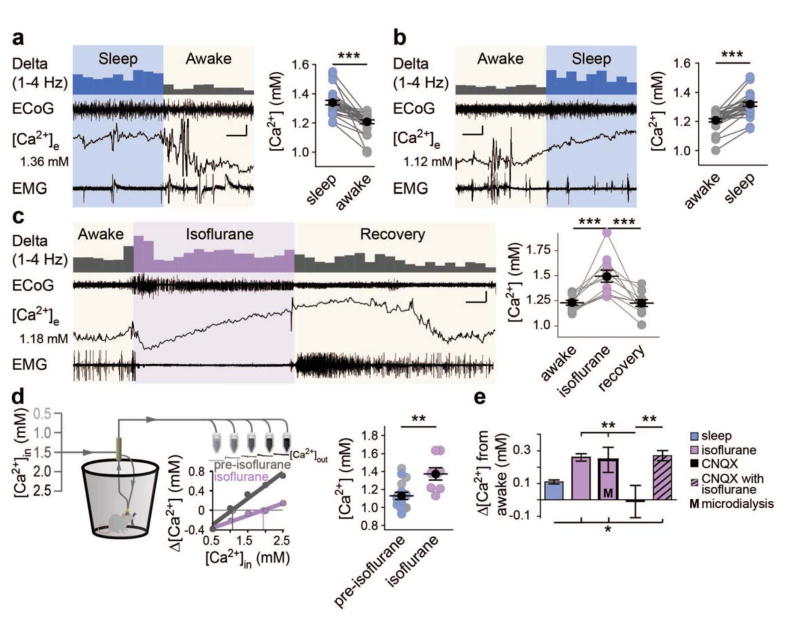
Fig. 3.
Extracellular Ca2+ decreases during wakefulness. (A and B) Representative ECoG, EMG, and [Ca2+]e recordings in sleep to awake (A) and awake to sleep (B). Initial [Ca2+]e is listed to the left with 1–4 Hz power presented above. n = 28 transitions. One-way, repeated measures ANOVA: F(3,81) = 39.91, P < 0.0001. Post-hoc Tukey test: ***P < 0.001. Scale bars: x = 20 s (A), 40 s (B), y: [Ca2+]e = 0.05 mM, 0.75 mV EMG/ECoG (C) Representative recording of isoflurane induction and recovery (ZT16-20) and data summary. n = 11 animals. One-way repeated measures ANOVA: F(2,20) = 18.52, P < 0.0001. Post-hoc Tukey test: ***P < 0.001. Scale bar: x = 6 min, y = [Ca2+]e = 0.2 mM, 0.5 mV EMG/ECoG. (D) Schematic of microdialysis collection. Individual sleep (light blue) and awake (gray) data are pooled and compared to isoflurane. n = 8 awake, 8 sleep, and 8 isoflurane. Two-tailed t-test of isoflurane versus non isoflurane: t(22) = 3.420, P = 0.003. **P < 0.01. (E) Comparisons of [Ca2+]e shifts from the awake to sleep, isoflurane, CNQX and CNQX + isoflurane. n =8 animals CNQX and CNQX + Isoflurane One-way ANOVA comparison of state-dependent shifts: F(4,117) = 5.824, P = 0.0003; Post-hoc Tukey test: *P < 0.05, **P < 0.01. Mean (black circle) ± SEM.

