Fig. 2.
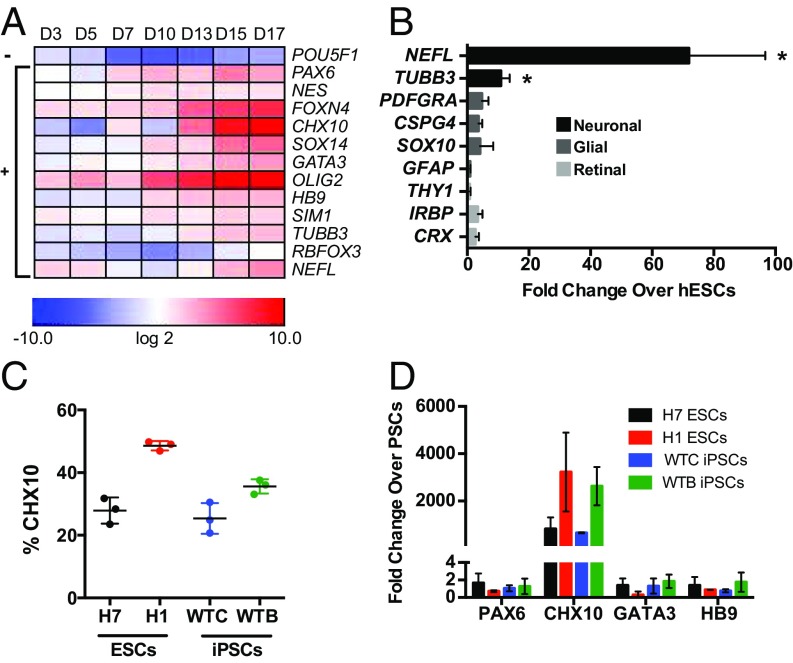
V2a interneuron protocol robustly increases hPSC neurogenesis. (A) Gene expression throughout V2a interneuron differentiation compared with undifferentiated H7 hESCs. − indicates that gene expression is significantly down-regulated (slope coefficient negative and different from 0, P < 0.05 using a linear time-trend model) through culture duration. + indicates that gene expression is significantly up-regulated (slope coefficient positive and different from 0; P < 0.05 using a linear time-trend model) throughout the duration of culture. (B) Neuronal, glial, and retinal gene expression at day 17 compared with H7 hESCs. NEFL and TUBB3 expression was increased by more than twofold (P < 0.05, unpaired t test). (C) CHX10 percentage of ESCs (H7 and H1) and iPSCs (WTB and WTC) differentiated with the V2a interneuron protocol. (D) Gene expression at day 17 compared with PSCs. Data represent mean ± SD.

