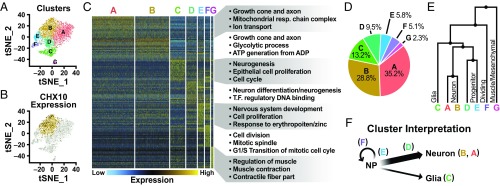
Fig. 4.
Single-cell RNAseq of V2a interneuron cultures. (A) tSNE plot of V2a interneuron cultures indicating seven clusters. (B) CHX10 expression (black dots) overlaid on cluster B (gold dots). Open circles represent the rest of the population. (C) Heatmap of the top 20 globally differentially expressed genes for each cluster. Expression values are normalized for each individual gene, with blue indicating low expression and yellow indicating high expression. GO terms for each cluster were determined through global and pairwise comparisons. (D) Percentage of cells found in each cluster. (E) Dendrogram of the relationships between clusters. (F) Interpretation of the different cell types comprising V2a interneuron cultures based on cluster analysis.

