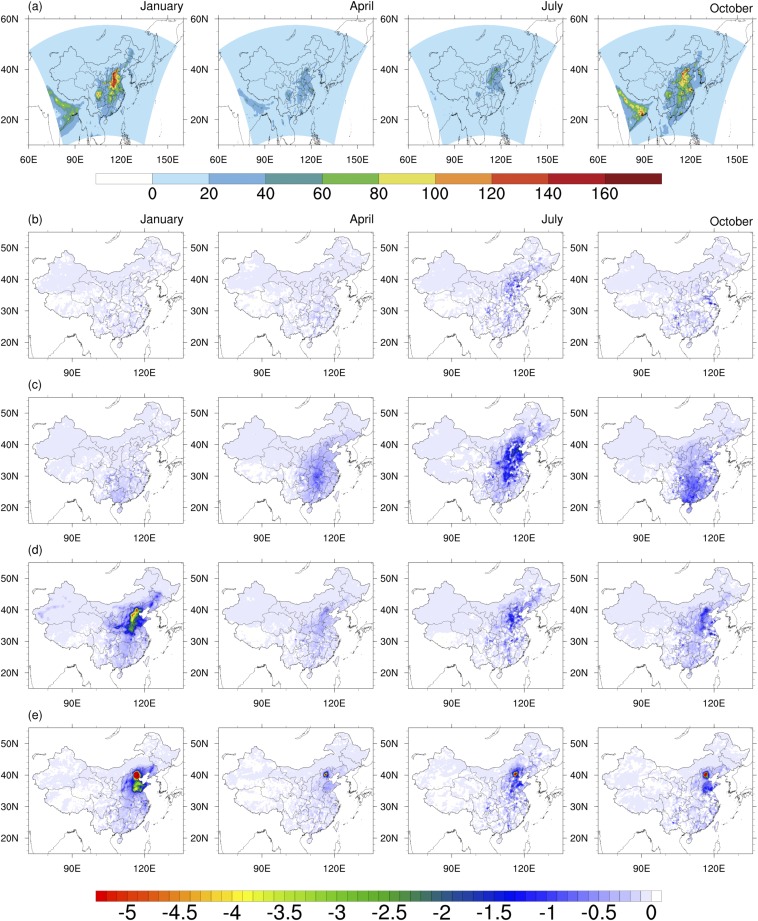
Fig. S3.
(A) The 2020 base case monthly mean PM2.5 surface concentrations. (B−E) 2020 monthly mean PM2.5 surface concentration changes between various medium SNG allocation scenarios and the base case: (B) SNG_Power – Base case, (C) SNG_Industry – Base case, (D) SNG_Region_Sector – Base case, and (E) SNG_Province – Base case. Note that the color scale used in B−E is one sixth of that used in Fig. 3 for the residential sector. (Unit is micrograms per cubic meter.)

