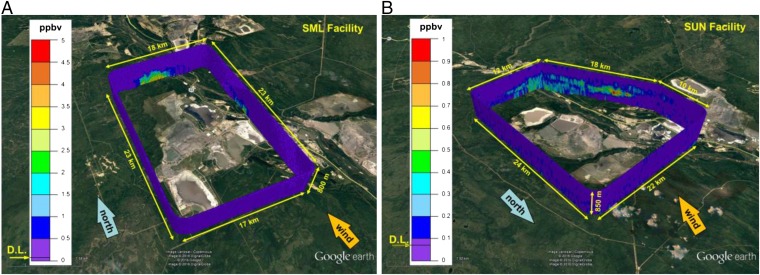
Fig. 1.
(A) Toluene (C7H8) mixing ratios, in parts per billion by volume (ppbv), on the walls of the virtual box created by stacking flight tracks around the SML facility from flight 2. (B) Similar plot for the SUN facility from flight 15. The PTRMS detection limit (D.L.) for toluene is shown on the color scales.

