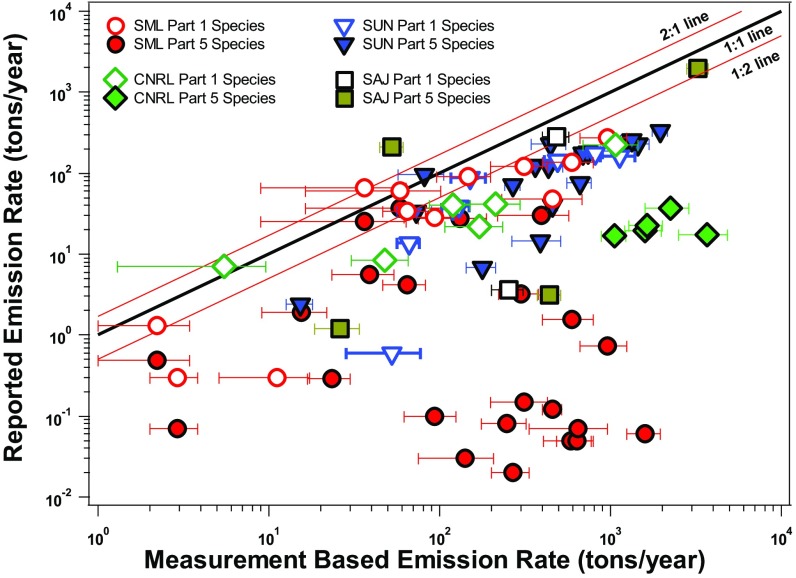
Fig. 5.
Comparison of 2013 emission rates for the individual species reported to the NPRI with the measurement-based emission rates for the same species. Each dot represents a reported species under either Part 1 or 5 reporting requirements (Methods). The horizontal bars represent the uncertainty range of the measurement-based emission rates (Methods).

