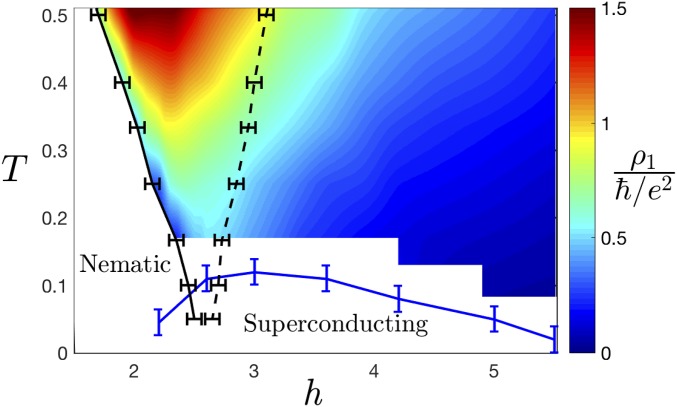
Fig. 1.
Phase diagram as a function of the transverse field and temperature , both measured in units of the fermion hopping . The solid and dashed black lines indicate, respectively, the boundary of the nematic phase () and a crossover (, defined shortly before Eq. 2) marking the edge of the quantum critical fan. The superconducting is indicated by the blue solid line. The color scale shows a proxy for the DC resistivity in units of , defined from the fit in Eq. 4. Here, , , . Error bars reflect finite-size errors, as described in SI Appendix.

