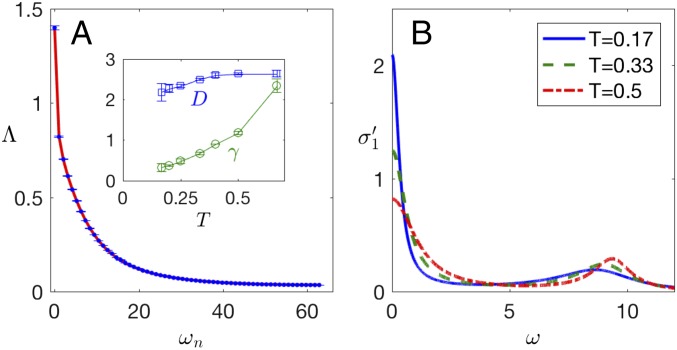
Fig. 4.
(A) The current−current correlator for a system with , for . Error bars are comparable to the symbol size. The solid red line is a least-squares fit to two components of the form of Eq. 4. (B) The corresponding real part of the optical conductivity for parameters in A, as well as two higher temperatures, showing how the Drude-like peak sharpens on cooling. The temperature dependence of the half-width at half-maximum of the Drude-like peak, as well as its weight , is shown in A, Inset, with error bars estimated as described in SI Appendix, section S-I, C.

