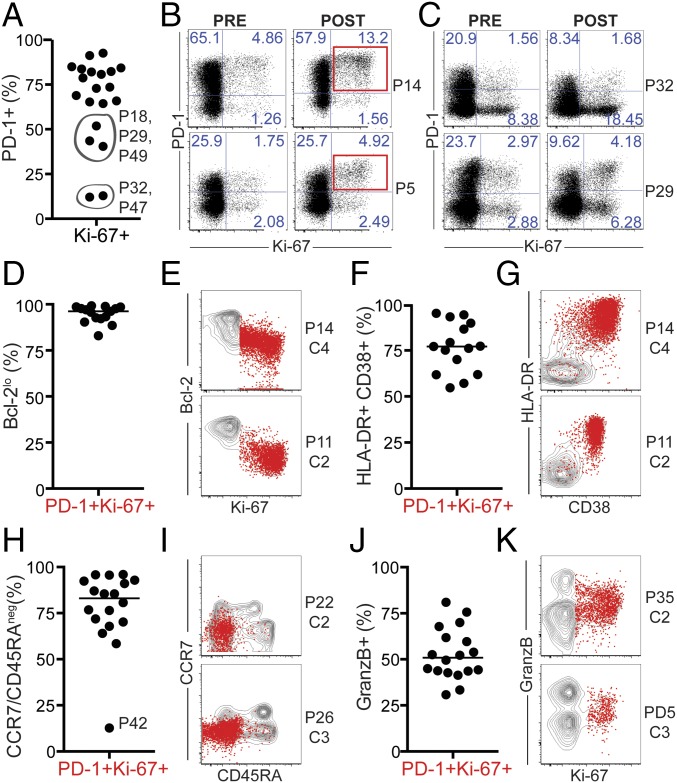
Fig. 2.
Blockade of the PD-1 pathway induces proliferation of effector-like PD-1+ CD8 T cells. Analysis was performed at the best CD8 T-cell response time point on NSCLC patients with ≥1.5-fold increase in Ki-67+ CD8 T cells after treatment (n = 20). Gates were determined based on naïve CD8 T cells. (A) Graph shows frequency of PD-1+ cells among Ki-67+ CD8 T cells. Patients whose responding Ki-67+ CD8 T cells were mostly PD-1neg are indicated by gray circles. P, patient. (B) Dot plots show proliferation and PD-1 expression on CD8 T cells, on two representative patients with PD-1+ CD8 T-cell responses. (C) As in B, but depicted are two representative patients with PD-1neg CD8 T-cell responses. (D) Graph shows frequency of Bcl-2lo cells. (E) Dot plots show proliferation and Bcl-2 expression on responding PD-1+ Ki-67+ T cells (red dots) over the contour plot for total CD8 T cells on two representative patients. (F) Graph shows frequency of HLA-DR+CD38+ cells. (G) Dot plots show HLA-DR and CD38 expression as in E. (H) Graph shows frequency of CCR7neg CD45RAneg cells. (I) Dot plots show CCR7 and CD45RA expression as in E. (J) Graph shows frequency of granzyme B+ cells. (K) Dot plots show Ki-67 and granzyme B expression as in E. P, patient; C, treatment cycle.

