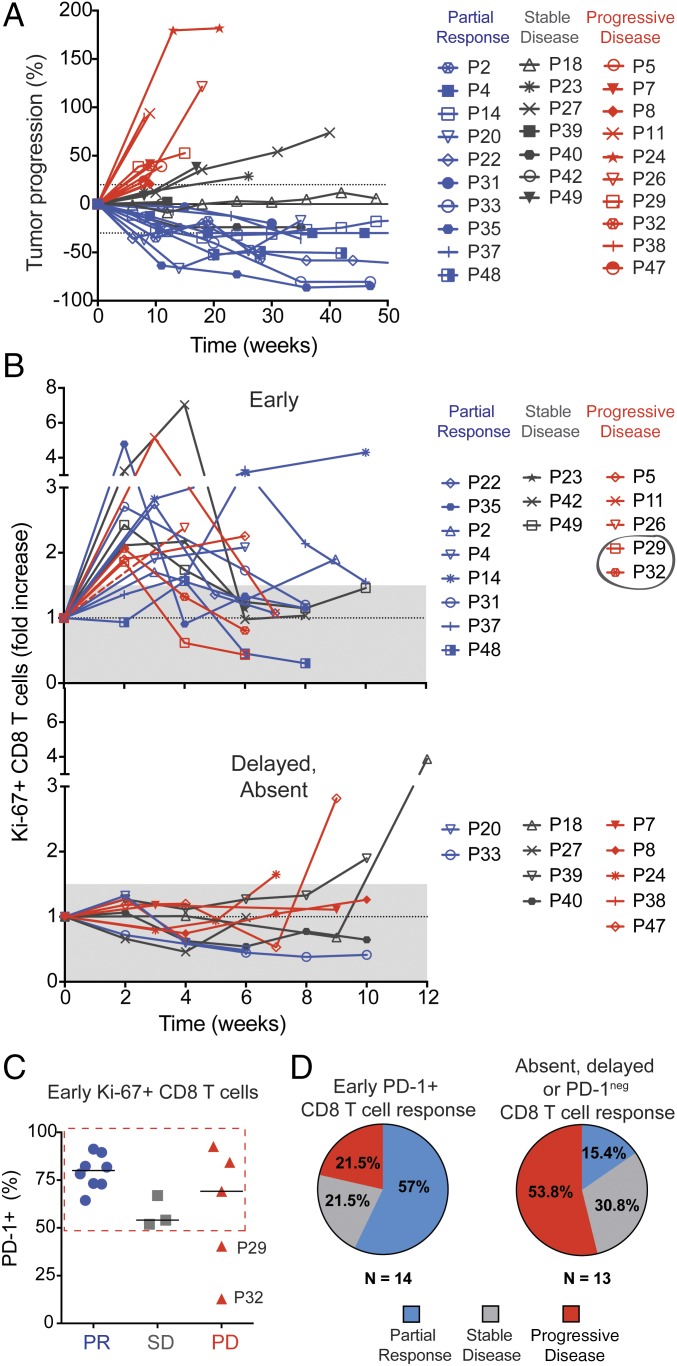
Fig. 5.
Early proliferation of PD-1+ CD8 T cells is correlative to clinical outcomes. (A) Spiderplot shows changes from baseline in the tumor burden as assessed by RECIST 1.1 (n = 27). (B) Graphs show fold increase in the proliferation of CD8 T cells at all time points analyzed. Patients whose responding Ki-67+ CD8 T cells were mostly PD-1neg are indicated by a gray circle. (C) Graph shows frequency of PD-1+ cells among Ki-67+ CD8 T cells induced within 4 wk of PD-1–targeted therapy initiation (patients in B Upper). (D) Graphs show frequency of different clinical outcomes on patients that displayed early PD-1+ CD8 T-cell responses and patients that had absent, delayed, or PD-1neg CD8 T-cell responses.

