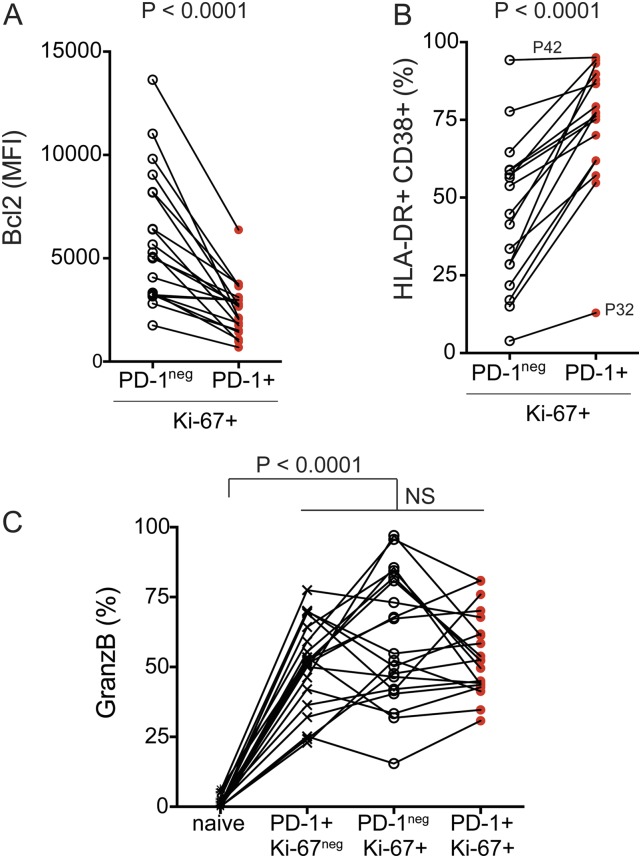
Fig. S6.
Characterization of peripheral blood CD8 T-cell following PD-1–targeted therapy of NSCLC patients. (A) Graph shows Bcl-2 expression levels on Ki-67+ CD8 T cells (comparison between PD-1neg and PD-1+). Paired Student t test. (B) Graph shows frequency of Ki-67+ CD8 T cells that coexpress HLA-DR and CD38 (comparison between PD-1neg and PD-1+). Paired Student t test. (C) Graph shows frequency of granzyme B+ cells among the indicated CD8 T-cell populations. Gates were determined based on naïve T cells. Repeated-measures ANOVA and Tukey’s multiple comparisons test. MFI, mean fluorescence intensity.

