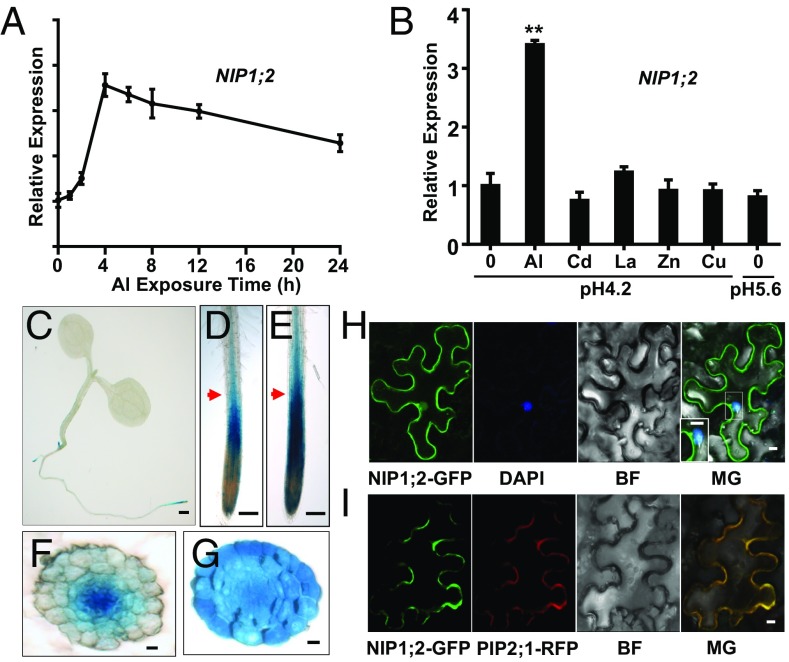
Fig. 2.
NIP1;2 expression patterns. (A) Time course qRT-PCR analysis of NIP1;2 gene expression in WT roots treated with 20 μM AlCl3 at pH 4.2. (B) qRT-PCR analysis of NIP1;2 expression in WT roots in response to different metal ions and pH changes. Here 7-d-old WT plants were treated with 20 μM AlCl3, 10 μM CdCl2, 5 μM LaCl3, 10 μM ZnSO4, or 5 μM CuSO4 at pH 4.2 for 6 h. The −Al experiment was conducted at pH 4.2 or pH 5.6 for 6 h. Asterisks indicate significant differences between 0 and 20 μM Al treatments (**P < 0.01). (C–G) Tissue-specific expression of NIP1;2. GUS activity driven by the NIP1;2 promoter in the whole plant (C) or root tips without (D) or with (E) 50 μM Al treatment for 8 h. Red arrows in D and E point to the positions of the cross-sections for - (F) or + (G) Al treatment, respectively. (Scale bars: 1 mm in C, 150 μm in D and E, and 10 μm in F and G.) (H and I) NIP1;2 is localized to the PM. (H) Confocal laser scanning microscopy of tobacco epidermal cells expressing 35Spro:NIP1;2::GFP. The nucleus (blue) was stained with DAPI. (I) Coexpression of NIP1;2-GFP (green) and the PM marker PIP1;2::RFP (red) in a tobacco epidermal cell. (Scale bar: 10 μm.) BR, brightfield; MG, merged.

