Fig. 4.
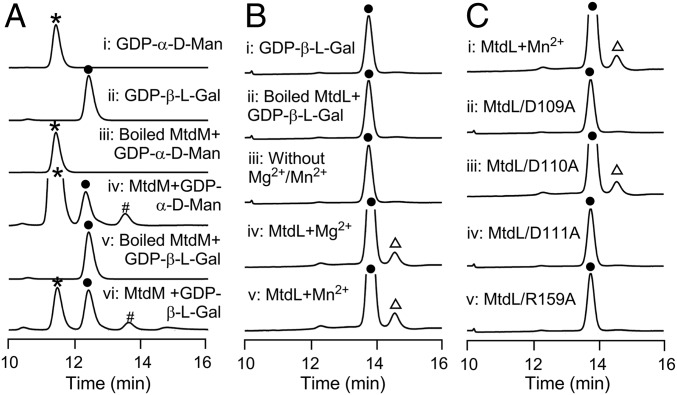
In vitro characterization of MtdM and MtdL-catalyzed reactions. (A) HPLC analysis of in vitro MtdM assays: (i) authentic GDP-α-d-mannose (GDP-α-d-Man); (ii) authentic GDP-β-l-galactose (GDP-β-l-Gal); (iii) control assay with boiled MtdM and GDP-α-d-Man; (iv) enzymatic reaction using MtdM and GDP-α-d-Man; (v) control assay with boiled MtdM and GDP-β-l-Gal; and (vi) enzymatic reaction using MtdM and GDP-β-l-Gal. (B) HPLC analysis of in vitro MtdL assays: (i) authentic GDP-β-l-Gal; (ii) control assay with boiled MtdL and GDP-β-l-Gal; (iii) control assay without Mg2+/Mn2+; and (iv and v) enzymatic reaction with Mg2+ or Mn2+, respectively. (C) HPLC analysis of the in vitro enzymatic reaction of (i) MtdL and its mutant variants; (ii) D109A; (iii) D110A; (iv) D111A; and (v) R159A, respectively. *: GDP-α-d-Man; ●: GDP-β-l-Gal; #: GDP-l-gulose; ∆: GDP-α-l-galactofuranose. λ = 254 nm.

