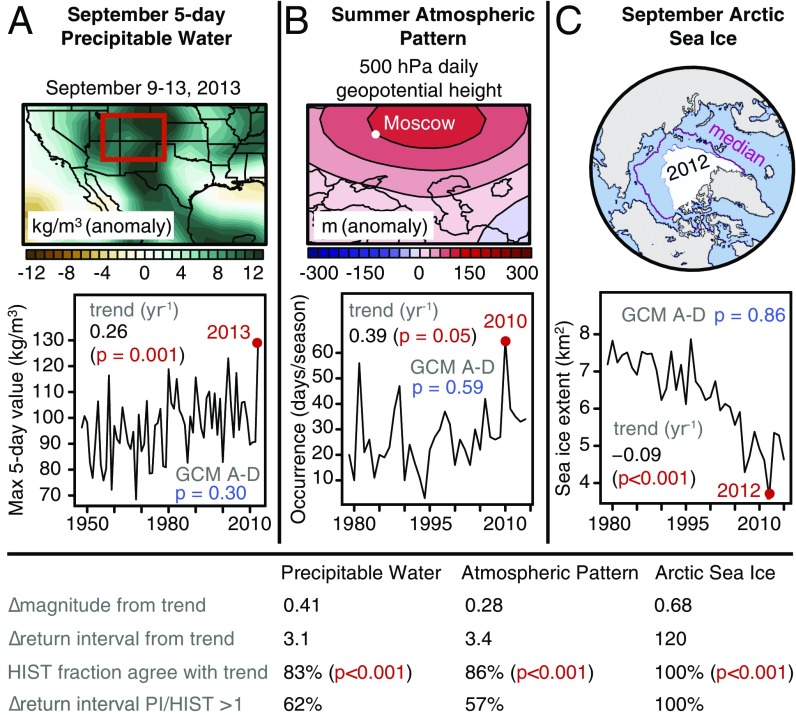
Fig. 4.
Analysis of climate variables associated with extreme climate events. (A) September 5-d precipitable water associated with the 2013 Colorado floods. (B) Summer 500-hPa geopotential height pattern associated with the 2010 Russia heatwave. (C) September Arctic sea ice extent. HIST, Historical Climate Model Simulations; PI, Pre-Industrial Control Simulation.

