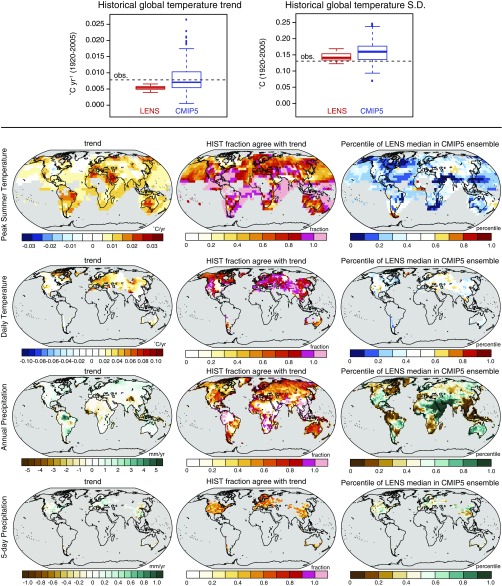
Fig. S5.
(Top) Box-and-whisker plots showing comparison of the global temperature trend (Left) and interannual SD (Right) in gridded observations, the LENS single-model ensemble, and the CMIP5 multimodel ensemble. (Bottom) Maps showing location of the LENS median trend value in the CMIP5 ensemble distribution (Right). For temperature variables, red (blue) colors indicate that the median LENS trend falls in the upper (lower) half of the CMIP5 distribution. For precipitation variables, green (brown) colors indicate that the median LENS trend falls in the upper (lower) half of the CMIP5 distribution. The observed trend (Left) and fraction of the LENS Historical realizations whose trend is of the same sign as the observed trend (Center) are reproduced from Figs. S1−S4 for reference. HIST, Historical Climate Model Simulations; S.D., interannual standard deviation.

