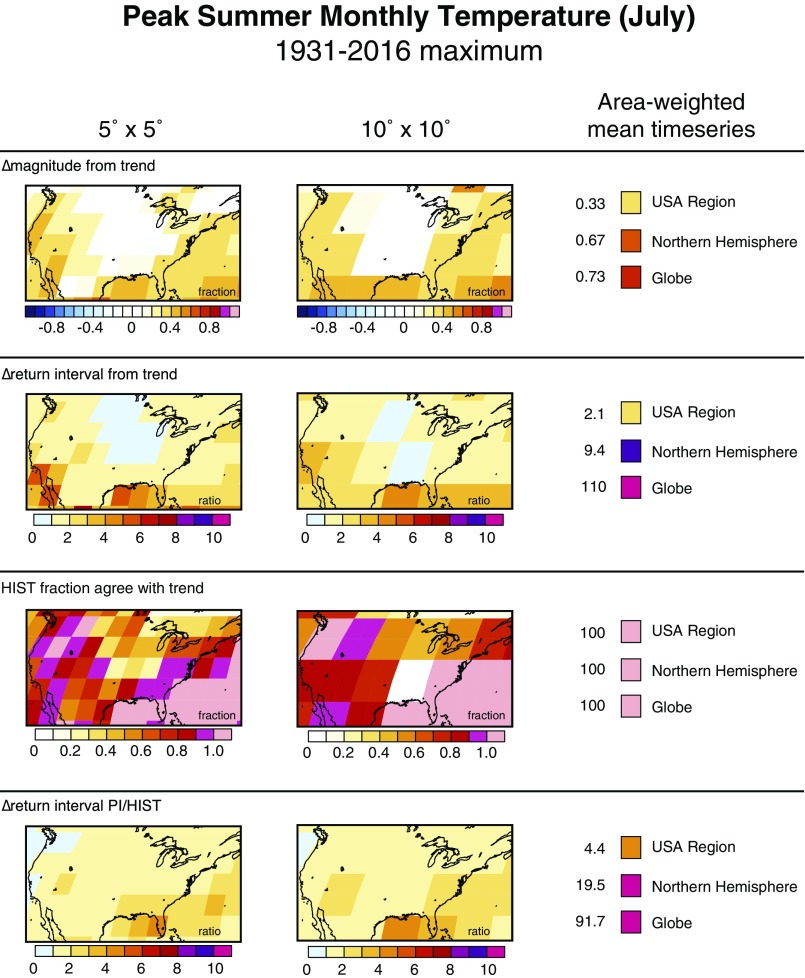
Fig. S6.
Quantification of attribution metrics for maximum July temperature at progressively larger spatial scales, including 5° × 5°, 10° × 10°, national, hemispheric, and global. All calculations are made using the grid points that exhibit continuous data availability over the 1931–2016 period (e.g., Fig. 2A). For each spatial scaling, the weighted area average time series is calculated first, and then the attribution metrics are calculated from the weighted area average time series. HIST, Historical Climate Model Simulations; PI, Pre-Industrial Control Simulation.

